
Every supply chain leader eventually has their "Albuquerque moment". It is the phone call at 6 a.m. saying a plant you have never visited, run by a supplier your supplier uses, has just burned, flooded or been shut by a lockdown. What happens in the next 72 hours decides whether your company shrugs it off or spends two years recovering.
The last 25 years have given us a brutal natural experiment. A lightning strike in New Mexico, an earthquake and tsunami in Japan, floods in Thailand, a pandemic, a ship wedged across the Suez Canal, record queues off Los Angeles, a global chip famine, missile attacks in the Red Sea and a bridge collapse in Baltimore. Each one hit thousands of companies at once. Some were crippled. Others recovered in days, and a few came out stronger.
We went through the peer-reviewed research, official investigation reports and government data on these events to pull out 25 research-backed lessons about what resilient companies did differently. Each lesson comes with the evidence, APA citations you can check, and three practical actions for managers, supervisors and operations leaders.
The short version: Disruptions are not rare. They are a normal cost of doing business that most firms underprice. The winners see trouble early, know which small parts can stop them, keep targeted buffers and real second sources, and have people empowered to act fast. Resilience is built before the crisis, not during it.
Key takeaways
- Markets punish disruptions hard. Announcing a supply chain glitch was followed by an average 10.28% abnormal drop in shareholder value (Hendricks & Singhal, 2003), and long-run abnormal returns of nearly −40% (Hendricks & Singhal, 2005b).
- "Rare" events are not rare. The McKinsey Global Institute (2020) estimates that disruptions lasting a month or longer now hit companies about every 3.7 years on average.
- The cheap parts are the dangerous ones. At Ford, a short disruption at about 61% of Tier 1 suppliers would not have dented profits, while roughly 2% of suppliers, mostly of inexpensive parts, could have caused very large losses (MIT News Office, 2013).
- Lean had gone too far in chips. Median inventories held by U.S. chip buyers fell from about 40 days in 2019 to less than 5 days in 2021 (U.S. Department of Commerce, 2022).
- Geopolitics now moves freight. Suez Canal trade volume fell 50% year-on-year in early 2024, Cape of Good Hope transits rose 74%, and diversions added 10 or more days (Kamali et al., 2024).
- Reshoring is not a magic shield. About a quarter of the pandemic's modelled GDP decline came through global supply chains, yet "renationalising" them did not generally make countries more resilient (Bonadio et al., 2021).
How to read this guide: The 25 lessons are grouped into four parts: the shocks themselves, seeing risk early, designing resilience in, and leading people through disruption. Citations in brackets lead to the full reference list at the bottom. This article is general information for managers, not legal, engineering, insurance or financial advice. Check decisions with qualified specialists and your own data.
Part 1: The shocks that rewrote the rules
Lesson 1: Speed of response beat size: the fire that split Nokia and Ericsson
On 17 March 2000, lightning caused a fire at a Philips chip plant in Albuquerque, New Mexico. The fire was small, but smoke and soot damage halted production for months. Nokia, which had multiple suppliers, quickly shifted orders to other Philips plants and to Japanese and American suppliers, and its production suffered little. Ericsson relied on a single source and lost an estimated $400 million in sales (Chopra & Sodhi, 2004). A later account notes that Nokia lined up an alternative within three days (Chopra & Sodhi, 2014). Ericsson's own history records an estimated shortfall of 7 million phones and a SEK 24 billion loss for its phone division in 2000, about half of it restructuring costs (Ericsson, n.d.). Sheffi (2005) uses the case to show that the two companies faced the same event, but one detected it faster, escalated it higher and moved first. Ericsson then rebuilt its approach with a dedicated risk organisation, formal supplier requirements and new tools (Norrman & Jansson, 2004).
What resilient leaders do:
- Set a rule that any supplier problem affecting a critical part reaches a named senior decision-maker within hours, not at the weekly meeting.
- Treat early, small warnings (a delayed shipment, a vague supplier email) as signals worth a phone call today.
- Pre-agree who can authorise emergency buys, expediting and capacity reservations, so speed is not lost to approvals.
Lesson 2: The supplier you have never heard of can stop your plant
The 2011 Great East Japan Earthquake disrupted automotive microcontrollers made by Renesas Electronics and supplied to Toyota through first-tier suppliers such as Denso. Matsuo (2015) analyses why it took Toyota about three months to return to pre-earthquake production and concludes that Toyota's coordination mechanism lacked direct control over key parts deep in its supplier layers. The damage did not stay local. Carvalho et al. (2021) show the shock travelled upstream and downstream to direct and indirect suppliers and customers, cutting Japan's real GDP growth by 0.47 percentage points the following year. Across the Pacific, output at Japanese-owned plants in the United States fell roughly one-for-one with the drop in imported inputs, meaning the parts could not easily be substituted (Boehm et al., 2019). Firms disrupted by the earthquake lost on average 5.21% of shareholder value in the following month (Hendricks et al., 2020).
What resilient leaders do:
- For your top products, ask each Tier 1 supplier to name where their critical inputs are actually made, down to the plant.
- Flag any part that has no substitute in the short term. These "Leontief" parts deserve special attention whatever their price.
- Agree with key suppliers in advance how they will tell you about their own suppliers' problems.
Lesson 3: Industrial clusters turn one local flood into a global shortage
In late 2011, months of flooding in Thailand inundated major industrial estates north of Bangkok. A World Bank assessment put total damage and losses at THB 1.43 trillion (about US$46.5 billion), with manufacturing bearing roughly 70% of the total because six industrial estates were flooded (World Bank, 2012). Those estates were home to large parts of the world's hard disk drive and automotive supply chains, so the shortages rippled worldwide (Haraguchi & Lall, 2015). Clustering is efficient: suppliers sit next to customers, share labour pools and cut transport costs. But it also concentrates exposure. Craighead et al. (2007) found disruption severity rises with supply chain density and node criticality, and they question the wisdom of sourcing from tight supply clusters without mitigation.
What resilient leaders do:
- Plot your critical suppliers' sites on a map with flood, earthquake and storm zones. Look for many "different" suppliers in the same place.
- Treat "two suppliers in the same industrial park" as one source for risk purposes.
- Ask suppliers in high-hazard areas for their flood defences, recovery plans and alternate sites in writing.
Lesson 4: A pandemic is a disruption that is everywhere, all at once, for a long time
Most continuity plans assume a single site goes down while the rest of the world carries on. COVID-19 broke that assumption. Ivanov (2020) argued early in the pandemic that epidemic outbreaks are a special case of supply chain risk, combining long duration with disruption spreading across many nodes at once. Ivanov and Dolgui (2020) proposed "viability", the ability to survive and adapt through a long crisis, as the right goal instead of a quick bounce-back. The firm-level data back this up. French firms that sourced inputs from China before its early lockdown saw a 5.5% relative drop in domestic sales and a 5% drop in exports between February and June 2020. Geographic diversification of inputs did not seem to soften the blow, but firms with relatively high inventories absorbed it better (Lafrogne-Joussier et al., 2023). Shortages of medical supplies showed how concentrated production and trade restrictions can combine in a crisis (Gereffi, 2020).
What resilient leaders do:
- Add a "long, global disruption" scenario to your plans: several regions affected at once for six months or more.
- Check whether your backup suppliers are exposed to the same shock as your main ones. Diversification across places that close together is not protection.
- Plan how to keep people safe and operations staffed if a large share of your workforce is unavailable for weeks.
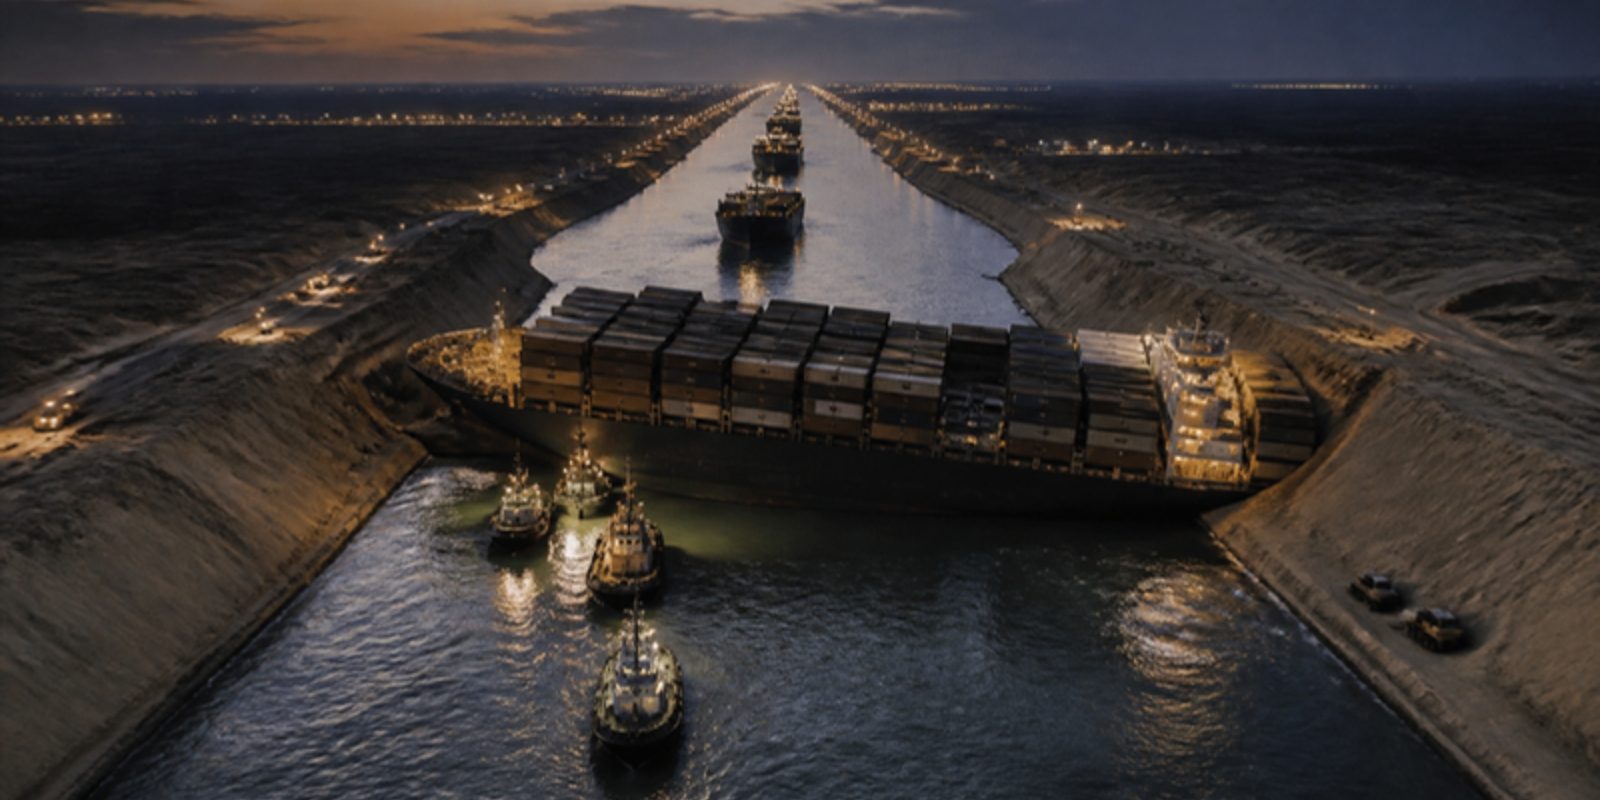
Lesson 5: One ship in one canal can freeze world trade
On 23 March 2021 the container ship Ever Given ran aground in the Suez Canal. It was refloated on 29 March, but more than 430 ships had queued at the two entrances, and about US$9 billion of trade was estimated to be held up each day. The backlog was not cleared until 3 April (Notteboom et al., n.d.). The Suez Canal is not a niche route. In 2023, an estimated 22% of global seaborne container trade passed through it (UNCTAD, 2024). Chokepoints like this are the transport equivalent of a single-source supplier. They work perfectly almost all the time, which is exactly why companies forget about them.
What resilient leaders do:
- List the canals, straits, ports and rail gateways your main flows depend on, and estimate how many days of delay each would cost you.
- Know the alternative routings and their extra cost and transit time before you need them.
- Build realistic lead-time buffers into promise dates for customers on chokepoint-dependent lanes.
Lesson 6: Port congestion is a system problem, not one bad actor
In 2021, the ports of Los Angeles and Long Beach, which together handle about 40% of containers entering the United States, were overwhelmed by a surge in imports. Through August 2021, container volumes were up 30% at Los Angeles and over 20% at Long Beach. The fix required ports, unions, retailers, carriers and truckers to move together towards 24/7 operations, with six large companies alone committing to move over 3,500 additional containers a week at night (The White House, 2021). Ships, terminals, chassis, warehouses and trucking capacity are links in one chain. Pushing more volume into a link that is already full only lengthens the queue. Lee et al. (1997) showed that order patterns get more volatile the further you move upstream, the "bullwhip effect", which helps explain why waves of panic ordering hit ports so hard.
What resilient leaders do:
- When a node is congested, look at the whole flow, including dwell times, empty-container returns and warehouse space, not just the port.
- Share real demand data with logistics partners so capacity is planned on consumption, not inflated orders.
- Build relationships with more than one port of entry and inland routing, and test them with small volumes in normal times.
Lesson 7: Lean without a buffer is fragile: the chip famine
The 2020–2023 semiconductor shortage showed what happens when just-in-time meets a demand surge and a capacity bottleneck. A U.S. Department of Commerce request for information drew more than 150 responses. It found median demand in 2021 up to 17% higher than in 2019, wafer production capacity as the main bottleneck, and median inventories held by chip buyers down from about 40 days in 2019 to less than 5 days in 2021 (U.S. Department of Commerce, 2022). An industry analysis by S&P Global Mobility (2023) estimates that more than 9.5 million units of global light-vehicle production were lost in 2021 because of missing chips, with another 3 million affected in 2022. Many of the chips involved were low-cost legacy parts, a reminder that the price of a component tells you nothing about the cost of not having it.
What resilient leaders do:
- Identify components with long manufacturing lead times and few producers, and hold strategic stock of those specifically.
- Give strategic suppliers longer-term demand visibility and, where it makes sense, capacity commitments.
- Review "lean" targets each year against the actual lead-time and concentration risk of each category.
Lesson 8: Geopolitics is now a logistics variable
From late 2023, attacks on shipping in the Red Sea pushed many carriers to divert around the Cape of Good Hope. UNCTAD (2024) estimated Suez transits were down 42% from their peak, and container tonnage crossing the canal fell 82% by the first half of February 2024. Tonnage entering the Gulf of Aden dropped over 70% while tonnage passing the Cape rose 60%. IMF PortWatch data showed Suez trade volume down 50% year-on-year in the first two months of 2024, Cape transits up an estimated 74%, and diversions adding 10 or more days on average (Kamali et al., 2024). UNCTAD (2024) noted that the Red Sea crisis came on top of drought-related limits in the Panama Canal and the war affecting the Black Sea, so three key waterways were under strain at once.
What resilient leaders do:
- Add geopolitical and security risk to your route risk reviews, alongside weather and capacity.
- Model what a 10–14 day transit increase does to your working capital, safety stock and customer service.
- Keep contracts flexible enough to switch routings or modes (for example, partial air or rail) for critical items.
Lesson 9: Infrastructure has single points of failure too
On 26 March 2024, the containership Dali lost power and struck the Francis Scott Key Bridge in Baltimore, collapsing it and killing six highway workers. The NTSB found the initial blackout was caused by a loose signal wire at a terminal block (National Transportation Safety Board [NTSB], 2025b). It also found that the bridge's owner had never carried out a vessel-collision vulnerability assessment. Had it done so, it would have found the bridge's risk was almost 30 times the industry threshold for critical bridges, and the NTSB asked owners of 68 other U.S. bridges to assess their own risk (NTSB, 2025a). Clearing about 50,000 tons of wreckage to fully reopen the port's main shipping channel took 76 days (U.S. Army Corps of Engineers [USACE], 2024). For shippers, the lesson is that roads, bridges, ports and power are part of your supply chain, even though you do not own them.
What resilient leaders do:
- Include public infrastructure (bridges, tunnels, port channels, power substations) in your risk map for key sites and lanes.
- Pre-plan alternate ports and inland routes for your highest-volume flows, including the paperwork and carrier agreements.
- Remember the people: in any infrastructure plan, the safety of workers and the public comes first.
Part 2: Seeing risk before it hits

Lesson 10: Disruptions destroy shareholder value, and it lasts for years
Hendricks and Singhal studied hundreds of publicly announced supply chain glitches. Announcements were followed by an average abnormal drop in shareholder value of 10.28% (Hendricks & Singhal, 2003). In a sample of 885 glitches, affected firms saw operating income fall 107% relative to controls in the year leading up to the announcement, with 6.92% lower sales growth and 10.66% higher cost growth, and no quick recovery over the next two years (Hendricks & Singhal, 2005a). Across 827 announcements, average abnormal stock returns from one year before to two years after were nearly −40%, and equity risk rose 13.50% in the year after (Hendricks & Singhal, 2005b). It did not matter who caused the glitch or what industry the firm was in. These are not "operations problems". They are board-level financial events.
What resilient leaders do:
- Present resilience investments to finance in shareholder-value and lost-margin terms, using this evidence.
- Track and report the cost of disruptions (expediting, lost sales, penalties) as a standing line in management reviews.
- Include supply chain risk in the enterprise risk register owned by senior leadership, not only in procurement.
Lesson 11: Plan for the "rare" event, because it keeps happening
The McKinsey Global Institute (2020) estimated that, averaged across industries, companies can expect disruptions lasting a month or longer every 3.7 years, and that expected losses add up to about 42% of one year's profits over a decade. Managers tend to underestimate rare events. Chopra and Sodhi (2014) argue that rough estimates are good enough: in their simulations, a 50% error in estimating disruption probability, in either direction, raised long-run disruption costs by less than 2%. In other words, the biggest mistake is not getting the probability slightly wrong. It is treating it as zero.
What resilient leaders do:
- Assume at least one serious, month-long disruption in your planning horizon and budget for it.
- Use simple ranges ("once every 3–10 years") rather than waiting for precise probabilities.
- Run a short "pre-mortem" each year: imagine your supply chain failed badly next year, then list the most likely reasons.
Lesson 12: Measure time to recover, not just probability
Simchi-Levi et al. (2014) proposed focusing first on impact rather than probability. Their model, built over three years with Ford, removes each node in the supply network in turn and estimates the financial damage, deferring probability until the company knows what a disruption would cost (Simchi-Levi et al., 2015). The results were surprising. A short disruption at about 61% of Ford's Tier 1 suppliers would not have cost profit, while about 2% of suppliers, mostly of inexpensive components, could have caused very large losses, and there was no correlation between spend with a supplier and the loss its failure would cause (MIT News Office, 2013). The approach rests on two numbers: time to recover, how long a node takes to return to full function, and time to survive, how long the chain can still match supply with demand after the disruption (Ham, 2022).
What resilient leaders do:
- For each critical node, estimate time to recover and time to survive. Where recovery is longer than survival, you have a gap to close.
- Stop ranking supplier risk by spend alone. Rank it by the revenue that would be lost if the part disappeared.
- Pay special attention to cheap, single-sourced parts on high-revenue products.
Lesson 13: Map beyond Tier 1, before the crisis
Early in the pandemic, Choi et al. (2020) reported that about 70% of 300 companies surveyed in early 2020 were still manually collecting data to find out which of their suppliers sat in locked-down regions of China. They note that after the 2011 earthquake, one Japanese semiconductor manufacturer reportedly needed a team of 100 people more than a year to map its supply network. Their advice is to start with the bill of materials for your top five products by revenue, trace suppliers as deep as possible, and record alternate sites and switching times. Research on 264 UK manufacturing plants found that information sharing and connectivity build supply chain visibility, which in turn improves both resilience and robustness (Brandon-Jones et al., 2014).
What resilient leaders do:
- Map the multi-tier network for your top five revenue products first. Do not try to map everything at once.
- Write mapping cooperation and recovery-time commitments into supplier contracts.
- Keep the map alive: update it at each new supplier award and each annual review.
Lesson 14: Watch the pressure gauges
The Federal Reserve Bank of New York's Global Supply Chain Pressure Index (GSCPI) combines 27 monthly variables, including shipping costs, airfreight prices and purchasing-manager survey data on delivery times, backlogs and purchased stocks in seven major economies, adjusted for demand (Benigno et al., 2022a, 2022b). It is measured in standard deviations from its average. The index shows a substantial rise in 2011 linked to the Tōhoku earthquake and the Thai floods, but these earlier spikes pale beside the pandemic era (Benigno et al., 2022a). New York Fed staff noted that readings above one standard deviation were very rare before 2020, while the index exceeded four standard deviations in late 2021 (Benigno et al., 2022a). The authors also found recent inflation, especially producer price inflation, closely related to the index (Benigno et al., 2022b).
What resilient leaders do:
- Add two or three external indicators (such as the GSCPI, freight rates and supplier delivery times) to your monthly operations review.
- Agree trigger levels in advance: "If X passes Y, we review safety stock and lead times."
- Combine external indicators with your own early signals, such as supplier on-time delivery trends and quote lead times.
Lesson 15: Stress-test your supply chain like a bank
After the 2008 financial crisis, regulators began stress-testing banks against severe scenarios. Simchi-Levi and Simchi-Levi (2020) argue that companies supplying critical goods should face similar stress tests of their supply chain resilience, and that firms can do this themselves: map the network, then test how each part would cope with and recover from a disruption. Operations research tools such as simulation and network models can help leaders see how disruptions ripple through a network (Ivanov & Dolgui, 2021), a pattern researchers call the "ripple effect" (Dolgui et al., 2018). The aim is not to predict the next crisis. It is to find the weak points before a real crisis finds them for you.
What resilient leaders do:
- Run a stress test at least once a year on three scenarios: loss of your biggest supplier, loss of a key port or route, and a 30% demand spike.
- Involve procurement, logistics, finance and sales in the exercise. The weak points are often at the handoffs.
- Turn each finding into an owner, an action and a deadline.
Part 3: Designing resilience into the network
Lesson 16: Resilience comes from redundancy or flexibility, and flexibility pays every day
Sheffi and Rice (2005) distinguish two ways to become resilient. Redundancy, such as spare inventory, spare capacity or extra suppliers, is a pure cost unless a disruption happens. Flexibility, such as standardised parts, interchangeable plants, cross-trained people and agile distribution, can also improve everyday performance, so it can often be justified on normal business results alone. Sheffi (2005) argues that a company's fate depends more on what it does before a disruption than during it, and his later work extends the analysis to deep-tier risks, cyber threats and long-lasting disruptions (Sheffi, 2015). Lee (2004) made a similar point from the competitive side: the best supply chains are not just fast and cheap but agile, adaptable and aligned.
What resilient leaders do:
- For each resilience proposal, ask: does this also help us in a normal week? Prioritise options that do.
- Standardise components across product lines where possible so one part can serve many products.
- Cross-train people on critical tasks so a staffing shock does not stop a line.
Lesson 17: Buffer the critical few, not everything
Inventory is the oldest form of resilience, and the evidence says it works when it is targeted. Firms with relatively high inventories absorbed the 2020 China lockdown shock better than others (Lafrogne-Joussier et al., 2023). Firms with more slack in their supply chain also suffered a less negative stock market reaction to disruptions (Hendricks et al., 2009). Tomlin (2006) showed mathematically that the right mix of strategies depends on the nature of disruptions. For a given level of supplier reliability, sourcing from a reliable supplier becomes more attractive than holding inventory as disruptions become rarer but longer. Blanket inventory increases are expensive. Targeted buffers on the parts with long recovery times are a bargain.
What resilient leaders do:
- Use your time-to-recover analysis to decide where strategic stock goes, and size it to cover the recovery gap.
- Consider holding buffers upstream (raw materials or common components) where they can serve many products.
- Review strategic buffers each quarter so they reflect current risk, not last year's crisis.
Lesson 18: A second source only counts if it can really ramp up
Nokia's advantage in 2000 was not just having other suppliers; those suppliers could take orders quickly (Chopra & Sodhi, 2004). Tomlin (2006) found that "contingent rerouting", switching volume to a backup supplier that has volume flexibility, is often part of the best strategy and can significantly cut costs. Chopra and Sodhi (2014) note that Samsung keeps at least two suppliers for key components, and that moving from one distribution centre to two greatly reduces fragility at modest cost. But multisourcing is not automatic protection. Elliott et al. (2022) show that whole supply networks can end up fragile in equilibrium, very sensitive to small shocks, even when individual firms multisource.
What resilient leaders do:
- Give backup suppliers real, regular volume so they stay qualified and ready to ramp up.
- Check that second sources do not share the same sub-supplier, raw material or region as the first.
- Agree surge-capacity terms (how much extra, how fast, at what price) in advance.
Lesson 19: Reshoring is not the same as resilience
After COVID-19, many politicians and executives called for bringing production home. The evidence is more cautious. A study of 64 countries found that about a quarter of the pandemic's modelled GDP decline came through global supply chains. However, "renationalising" supply chains did not in general make countries more resilient, because domestic inputs were disrupted by domestic lockdowns too (Bonadio et al., 2021). OECD simulations found that re-localising value chains would make most economies both less efficient and less stable, concluding that "The economic case for policy-induced reshoring of GVCs is therefore weak" (Arriola et al., 2020, abstract). Miroudot (2020) notes that, in the supply chain literature, reshoring does not lead to resilience. In the Ford research, moving suppliers closer to North America did not automatically improve resiliency (Ham, 2022). Baldwin and Freeman (2022) argue that the real question is how to manage the risks of global chains well, not whether to have them.
What resilient leaders do:
- Judge any nearshoring or reshoring proposal by its effect on time to recover and concentration, not by distance alone.
- Prefer diversification across several regions with different risk profiles over moving everything to one new place.
- Keep the business case honest: include higher costs, capacity limits and new local risks.
Lesson 20: Segment your supply chain instead of running one size fits all
Chopra and Sodhi (2014) argue that some resilience moves also cut costs. Their main tools are segmentation and regionalisation. Zara, for example, makes fast-fashion items close to its European market and sources basic items from lower-cost locations, so a disruption in one area does not stop everything. W.W. Grainger keeps fast-moving items in about 400 stores and slow-moving items in a central distribution centre. The authors also point to 2011, when Japanese automakers' dependence on parts from the tsunami-hit region disrupted plants worldwide, as a case for serving regions from regional supply. Lee (2004) adds that adaptability, spotting structural shifts in markets and adjusting the network to them, is a core feature of the best supply chains.
What resilient leaders do:
- Segment products by volume, variety and demand uncertainty, and design a different supply strategy for each segment.
- Put your most critical or fastest-moving products on the most resilient (often shortest) paths.
- Revisit the segmentation every year as products, markets and risks change.
Lesson 21: Suppliers who trust you will save you
The model for collaborative recovery predates our 25-year window. In 1997, a fire at Aisin Seiki, Toyota's main source of a crucial brake part, threatened to shut Toyota down. Group suppliers improvised alternative production and kept the part flowing, demonstrating cohesion and resilience when many observers thought traditional group ties were weakening (Nishiguchi & Beaudet, 1998). That response grew out of years of investment in knowledge sharing: Dyer and Nobeoka (2000) describe how Toyota built supplier associations, consulting teams and learning teams that made sharing know-how the norm. Christopher and Peck (2004) list collaboration as one of the core principles of a resilient supply chain. Ericsson's post-fire approach also combined closer work with suppliers and formal requirements on them (Norrman & Jansson, 2004).
What resilient leaders do:
- Invest in a few deep supplier relationships with regular joint reviews, shared improvement projects and open books on risk.
- Pay suppliers fairly and on time in normal periods. Goodwill is what you draw on in a crisis.
- Agree in advance how you will share capacity, information and costs during a disruption.
Part 4: Leading people through disruption
Lesson 22: Resilience is a culture, not a binder on a shelf
In Sheffi and Rice's (2005) framework, corporate culture is one of the five areas where flexibility is built, alongside suppliers, conversion processes, distribution channels and control systems. Christopher and Peck (2004) argue that a supply chain risk management culture is a core principle of resilience. Ponomarov and Holcomb (2009) define supply chain resilience as an adaptive capability to prepare for unexpected events, respond to disruptions and recover from them. Wieland and Durach (2021) push further: resilience is not only about bouncing back to the old state but also about the capacity to adapt and transform. All of these depend on people who notice problems, speak up and act within clear limits without waiting for permission.
What resilient leaders do:
- Praise the person who raises an early warning, even when it turns out to be a false alarm.
- Give frontline supervisors clear authority and spending limits for emergency actions.
- After each disruption, run a blame-free review focused on what to change, and publish the lessons.
Lesson 23: Do not feed the bullwhip with panic orders
Lee et al. (1997) showed that orders tend to be more variable than actual sales, and that the distortion grows as you move upstream. They identified four causes: demand signal processing, rationing games (ordering more when you expect to be rationed), order batching and price swings. In a shortage, every buyer's instinct to over-order to secure supply is rational alone but harmful together, because it makes the shortage look bigger than it is and leaves inventory gluts when the panic ends. Shih (2020) argues that companies must rethink very lean strategies after the pandemic, but the bullwhip research warns against swinging to the opposite extreme in a hurry.
What resilient leaders do:
- Share point-of-sale or consumption data with suppliers so they plan on real demand, not inflated orders.
- In a shortage, order what you need plus an agreed buffer, and tell suppliers so. Do not "phantom order".
- Plan your exit from crisis buying early, so you do not end up with an expensive glut.
Lesson 24: Rehearse the plan, and use the standards
Plans that are never practised tend to fail at the first contact with reality. ISO 22301:2019 sets out requirements for a business continuity management system: a documented system to plan, implement, monitor, review and continually improve an organisation's ability to protect against, reduce the likelihood of, and recover from disruptive incidents (International Organization for Standardization [ISO], 2019). ISO 28000:2022 covers security management systems, including aspects relevant to the supply chain, and is designed to integrate with ISO 22301 (ISO, 2022). Pettit et al. (2013) developed and tested an assessment tool that helps companies measure their resilience against their vulnerabilities, so they can see where they are exposed or over-invested.
What resilient leaders do:
- Run at least one tabletop exercise a year on a realistic scenario, with suppliers and logistics partners in the room.
- Use ISO 22301 as a checklist even if you do not seek certification.
- Test your contact lists, decision rights and data access during the exercise, not during the real event.
Lesson 25: Build resilience as a balanced capability with a business case
Pettit et al. (2010) describe resilience as a balance: as vulnerabilities rise, capabilities must rise to match. Too few capabilities leave you exposed. Too many erode profits. Kleindorfer and Saad (2005) frame disruption risk management as an ongoing process of identifying sources of risk, assessing them and choosing mitigation, rather than a one-off project. The financial case is strong. Disruptions are linked to large and lasting losses in operating performance and shareholder value (Hendricks & Singhal, 2005a, 2005b), while firms with more operational slack see a smaller stock market penalty (Hendricks et al., 2009). Resilience is not free, but neither is fragility.
What resilient leaders do:
- Score your top risks for exposure and your matching capabilities, and invest where the gap is largest.
- Build a simple business case that compares the cost of a resilience action with the expected cost of the disruption it covers.
- Review the balance every year, because vulnerabilities shift with new products, suppliers and geopolitics.
Your 10-point resilience action plan
The same handful of moves came up again and again across 25 years of disruption research. Start here:
- Map your top five products deep. Trace suppliers beyond Tier 1 and record alternate sites and switching times.
- Find your hidden 2%. Rank suppliers by revenue at risk, not by spend.
- Calculate time to recover and time to survive. Close every gap where recovery takes longer than survival.
- Buffer the critical few. Hold strategic stock of long-lead, single-source parts.
- Make second sources real. Give them volume and agree surge terms in advance.
- List your chokepoints. Canals, ports, bridges and gateways, with alternatives costed.
- Watch two or three pressure gauges. Set trigger levels and act when they are crossed.
- Stress-test and rehearse once a year. Include suppliers, logistics partners and finance.
- Empower the front line. Clear escalation rules, decision rights and spending limits.
- Keep the business case current. Track disruption costs and report them to senior leadership.
Ready to lead through the next disruption? Explore BLTI's logistics, transportation and operations credentials in our BLTI courses, and take the free Leadership Flex Check to see how you lead under pressure.
Frequently asked questions
What is supply chain resilience?
Supply chain resilience is the ability to prepare for unexpected events, respond to disruptions and recover from them, ideally while keeping operations running (Ponomarov & Holcomb, 2009). More recent research adds the capacity to adapt and transform after a shock, not just bounce back (Wieland & Durach, 2021).
What are the biggest supply chain disruptions of the last 25 years?
Major examples include the 2000 Philips fire in Albuquerque, the 2011 Great East Japan Earthquake, the 2011 Thailand floods, the COVID-19 pandemic, the 2021 Ever Given blockage of the Suez Canal, 2021 port congestion in Los Angeles and Long Beach, the 2020–2023 semiconductor shortage, Red Sea shipping attacks from late 2023, and the 2024 collapse of Baltimore's Key Bridge.
How often do major supply chain disruptions happen?
The McKinsey Global Institute (2020) estimates that, on average across industries, companies face a disruption lasting a month or longer about every 3.7 years. That is frequent enough to plan and budget for.
Is reshoring the best way to make a supply chain resilient?
Not by itself. Research on the pandemic found that renationalising supply chains did not generally make countries more resilient (Bonadio et al., 2021), and OECD simulations found re-localisation would make most economies less efficient and less stable (Arriola et al., 2020). Diversification, visibility and targeted buffers usually matter more than distance.
What is the difference between time to recover and time to survive?
Time to recover is how long a disrupted supplier, plant or route takes to return to full function. Time to survive is how long your supply chain can keep meeting demand after the disruption (Ham, 2022). When recovery takes longer than survival, you need a mitigation plan.
About this research
This guide was compiled by the Better Leaders Training Institute (BLTI) research team. Every source below was checked for authors, year, title, publisher and DOI or stable link, using Crossref records, publishers' pages and the original official documents where available. We prioritised peer-reviewed studies, official investigation reports and data from government and intergovernmental bodies, and research from established institutions. Where a figure comes from a working paper, an industry analysis, staff commentary or a secondary summary, we say so in the text. Findings describe specific events, samples and models; your organisation's exposure may differ. This article is general information, not legal, engineering, insurance or financial advice.
References
Arriola, C., Guilloux-Nefussi, S., Koh, S.-H., Kowalski, P., Rusticelli, E., & van Tongeren, F. (2020). Efficiency and risks in global value chains in the context of COVID-19 (OECD Economics Department Working Papers No. 1637). OECD Publishing. https://doi.org/10.1787/3e4b7ecf-en
Baldwin, R., & Freeman, R. (2022). Risks and global supply chains: What we know and what we need to know. Annual Review of Economics, 14, 153–180. https://doi.org/10.1146/annurev-economics-051420-113737
Benigno, G., di Giovanni, J., Groen, J. J. J., & Noble, A. I. (2022a, January 4). A new barometer of global supply chain pressures. Liberty Street Economics. Federal Reserve Bank of New York. https://libertystreeteconomics.newyorkfed.org/2022/01/a-new-barometer-of-global-supply-chain-pressures/
Benigno, G., di Giovanni, J., Groen, J. J. J., & Noble, A. I. (2022b). The GSCPI: A new barometer of global supply chain pressures (Staff Report No. 1017). Federal Reserve Bank of New York. https://doi.org/10.2139/ssrn.4114973
Boehm, C. E., Flaaen, A., & Pandalai-Nayar, N. (2019). Input linkages and the transmission of shocks: Firm-level evidence from the 2011 Tōhoku earthquake. The Review of Economics and Statistics, 101(1), 60–75. https://doi.org/10.1162/rest_a_00750
Bonadio, B., Huo, Z., Levchenko, A. A., & Pandalai-Nayar, N. (2021). Global supply chains in the pandemic. Journal of International Economics, 133, Article 103534. https://doi.org/10.1016/j.jinteco.2021.103534
Brandon-Jones, E., Squire, B., Autry, C. W., & Petersen, K. J. (2014). A contingent resource-based perspective of supply chain resilience and robustness. Journal of Supply Chain Management, 50(3), 55–73. https://doi.org/10.1111/jscm.12050
Carvalho, V. M., Nirei, M., Saito, Y. U., & Tahbaz-Salehi, A. (2021). Supply chain disruptions: Evidence from the Great East Japan Earthquake. The Quarterly Journal of Economics, 136(2), 1255–1321. https://doi.org/10.1093/qje/qjaa044
Choi, T. Y., Rogers, D., & Vakil, B. (2020, March 27). Coronavirus is a wake-up call for supply chain management. Harvard Business Review. https://hbr.org/2020/03/coronavirus-is-a-wake-up-call-for-supply-chain-management
Chopra, S., & Sodhi, M. S. (2004, October 15). Managing risk to avoid supply-chain breakdown. MIT Sloan Management Review. https://sloanreview.mit.edu/article/managing-risk-to-avoid-supplychain-breakdown/
Chopra, S., & Sodhi, M. S. (2014, March 18). Reducing the risk of supply chain disruptions. MIT Sloan Management Review. https://sloanreview.mit.edu/article/reducing-the-risk-of-supply-chain-disruptions/
Christopher, M., & Peck, H. (2004). Building the resilient supply chain. The International Journal of Logistics Management, 15(2), 1–14. https://doi.org/10.1108/09574090410700275
Craighead, C. W., Blackhurst, J., Rungtusanatham, M. J., & Handfield, R. B. (2007). The severity of supply chain disruptions: Design characteristics and mitigation capabilities. Decision Sciences, 38(1), 131–156. https://doi.org/10.1111/j.1540-5915.2007.00151.x
Dolgui, A., Ivanov, D., & Sokolov, B. (2018). Ripple effect in the supply chain: An analysis and recent literature. International Journal of Production Research, 56(1–2), 414–430. https://doi.org/10.1080/00207543.2017.1387680
Dyer, J. H., & Nobeoka, K. (2000). Creating and managing a high-performance knowledge-sharing network: The Toyota case. Strategic Management Journal, 21(3), 345–367. https://doi.org/10.1002/(SICI)1097-0266(200003)21:3<345::AID-SMJ96>3.0.CO;2-N
Elliott, M., Golub, B., & Leduc, M. V. (2022). Supply network formation and fragility. American Economic Review, 112(8), 2701–2747. https://doi.org/10.1257/aer.20210220
Ericsson. (n.d.). The problem with mobile phones. Retrieved October 24, 2026, from https://www.ericsson.com/en/about-us/history/changing-the-world/big-bang/the-problem-with-mobile-phones
Gereffi, G. (2020). What does the COVID-19 pandemic teach us about global value chains? The case of medical supplies. Journal of International Business Policy, 3(3), 287–301. https://doi.org/10.1057/s42214-020-00062-w
Ham, B. (2022, June 15). Companies use MIT research to identify and respond to supply chain risks. MIT News. https://news.mit.edu/2022/companies-use-mit-research-identify-respond-supply-chain-risks-0615
Haraguchi, M., & Lall, U. (2015). Flood risks and impacts: A case study of Thailand's floods in 2011 and research questions for supply chain decision making. International Journal of Disaster Risk Reduction, 14, 256–272. https://doi.org/10.1016/j.ijdrr.2014.09.005
Hendricks, K. B., Jacobs, B. W., & Singhal, V. R. (2020). Stock market reaction to supply chain disruptions from the 2011 Great East Japan Earthquake. Manufacturing & Service Operations Management, 22(4), 683–699. https://doi.org/10.1287/msom.2019.0777
Hendricks, K. B., & Singhal, V. R. (2003). The effect of supply chain glitches on shareholder wealth. Journal of Operations Management, 21(5), 501–522. https://doi.org/10.1016/j.jom.2003.02.003
Hendricks, K. B., & Singhal, V. R. (2005a). Association between supply chain glitches and operating performance. Management Science, 51(5), 695–711. https://doi.org/10.1287/mnsc.1040.0353
Hendricks, K. B., & Singhal, V. R. (2005b). An empirical analysis of the effect of supply chain disruptions on long-run stock price performance and equity risk of the firm. Production and Operations Management, 14(1), 35–52. https://doi.org/10.1111/j.1937-5956.2005.tb00008.x
Hendricks, K. B., Singhal, V. R., & Zhang, R. (2009). The effect of operational slack, diversification, and vertical relatedness on the stock market reaction to supply chain disruptions. Journal of Operations Management, 27(3), 233–246. https://doi.org/10.1016/j.jom.2008.09.001
International Organization for Standardization. (2019). Security and resilience: Business continuity management systems: Requirements (ISO Standard No. 22301:2019). https://www.iso.org/standard/75106.html
International Organization for Standardization. (2022). Security and resilience: Security management systems: Requirements (ISO Standard No. 28000:2022). https://www.iso.org/standard/79612.html
Ivanov, D. (2020). Predicting the impacts of epidemic outbreaks on global supply chains: A simulation-based analysis on the coronavirus outbreak (COVID-19/SARS-CoV-2) case. Transportation Research Part E: Logistics and Transportation Review, 136, Article 101922. https://doi.org/10.1016/j.tre.2020.101922
Ivanov, D., & Dolgui, A. (2020). Viability of intertwined supply networks: Extending the supply chain resilience angles towards survivability. A position paper motivated by COVID-19 outbreak. International Journal of Production Research, 58(10), 2904–2915. https://doi.org/10.1080/00207543.2020.1750727
Ivanov, D., & Dolgui, A. (2021). OR-methods for coping with the ripple effect in supply chains during COVID-19 pandemic: Managerial insights and research implications. International Journal of Production Economics, 232, Article 107921. https://doi.org/10.1016/j.ijpe.2020.107921
Kamali, P., Koepke, R., Sozzi, A., & Verschuur, J. (2024, March 7). Red Sea attacks disrupt global trade. IMF Blog. International Monetary Fund. https://www.imf.org/en/Blogs/Articles/2024/03/07/Red-Sea-Attacks-Disrupt-Global-Trade
Kleindorfer, P. R., & Saad, G. H. (2005). Managing disruption risks in supply chains. Production and Operations Management, 14(1), 53–68. https://doi.org/10.1111/j.1937-5956.2005.tb00009.x
Lafrogne-Joussier, R., Martin, J., & Mejean, I. (2023). Supply shocks in supply chains: Evidence from the early lockdown in China. IMF Economic Review, 71(1), 170–215. https://doi.org/10.1057/s41308-022-00166-8
Lee, H. L. (2004). The triple-A supply chain. Harvard Business Review, 82(10). https://hbr.org/2004/10/the-triple-a-supply-chain
Lee, H. L., Padmanabhan, V., & Whang, S. (1997). Information distortion in a supply chain: The bullwhip effect. Management Science, 43(4), 546–558. https://doi.org/10.1287/mnsc.43.4.546
Matsuo, H. (2015). Implications of the Tohoku earthquake for Toyota's coordination mechanism: Supply chain disruption of automotive semiconductors. International Journal of Production Economics, 161, 217–227. https://doi.org/10.1016/j.ijpe.2014.07.010
McKinsey Global Institute. (2020). Risk, resilience, and rebalancing in global value chains. McKinsey & Company. https://www.mckinsey.com/mgi/our-research/risk-resilience-and-rebalancing-in-global-value-chains
Miroudot, S. (2020). Reshaping the policy debate on the implications of COVID-19 for global supply chains. Journal of International Business Policy, 3(4), 430–442. https://doi.org/10.1057/s42214-020-00074-6
MIT News Office. (2013, December 16). Hidden risk in supply chains. MIT News. https://news.mit.edu/2013/hidden-risk-in-supply-chains-1216
National Transportation Safety Board. (2025a, March 20). NTSB recommends 68 bridges in US be evaluated for risk of collapse from vessel strike [Press release]. https://www.ntsb.gov/news/press-releases/Pages/nr20250320.aspx
National Transportation Safety Board. (2025b, November 18). Loose wire on containership Dali leads to blackouts and contact with Baltimore's Francis Scott Key Bridge [Press release]. https://www.ntsb.gov/news/press-releases/Pages/NR20251118.aspx
Nishiguchi, T., & Beaudet, A. (1998). The Toyota group and the Aisin fire. Sloan Management Review, 40(1), 49–59. https://sloanreview.mit.edu/article/the-toyota-group-and-the-aisin-fire/
Norrman, A., & Jansson, U. (2004). Ericsson's proactive supply chain risk management approach after a serious sub-supplier accident. International Journal of Physical Distribution & Logistics Management, 34(5), 434–456. https://doi.org/10.1108/09600030410545463
Notteboom, T., Pallis, A., & Rodrigue, J.-P. (n.d.). Blockage of the Suez Canal, March 2021. Port Economics, Management and Policy. Retrieved October 24, 2026, from https://porteconomicsmanagement.org/suez-canal-blockage-2021/
Pettit, T. J., Croxton, K. L., & Fiksel, J. (2013). Ensuring supply chain resilience: Development and implementation of an assessment tool. Journal of Business Logistics, 34(1), 46–76. https://doi.org/10.1111/jbl.12009
Pettit, T. J., Fiksel, J., & Croxton, K. L. (2010). Ensuring supply chain resilience: Development of a conceptual framework. Journal of Business Logistics, 31(1), 1–21. https://doi.org/10.1002/j.2158-1592.2010.tb00125.x
Ponomarov, S. Y., & Holcomb, M. C. (2009). Understanding the concept of supply chain resilience. The International Journal of Logistics Management, 20(1), 124–143. https://doi.org/10.1108/09574090910954873
S&P Global Mobility. (2023, July 13). The semiconductor shortage is (mostly) over for the auto industry [Press release]. https://press.spglobal.com/2023-07-13-S-P-Global-Mobility-The-semiconductor-shortage-is-mostly-over-for-the-auto-industry
Sheffi, Y. (2005). The resilient enterprise: Overcoming vulnerability for competitive advantage. MIT Press.
Sheffi, Y. (2015). The power of resilience: How the best companies manage the unexpected. MIT Press.
Sheffi, Y., & Rice, J. B., Jr. (2005). A supply chain view of the resilient enterprise. MIT Sloan Management Review, 47(1). https://sloanreview.mit.edu/article/a-supply-chain-view-of-the-resilient-enterprise/
Shih, W. C. (2020). Global supply chains in a post-pandemic world. Harvard Business Review. https://hbr.org/2020/09/global-supply-chains-in-a-post-pandemic-world
Simchi-Levi, D., Schmidt, W., & Wei, Y. (2014). From superstorms to factory fires: Managing unpredictable supply-chain disruptions. Harvard Business Review. https://hbr.org/2014/01/from-superstorms-to-factory-fires-managing-unpredictable-supply-chain-disruptions
Simchi-Levi, D., Schmidt, W., Wei, Y., Zhang, P. Y., Combs, K., Ge, Y., Gusikhin, O., Sanders, M., & Zhang, D. (2015). Identifying risks and mitigating disruptions in the automotive supply chain. Interfaces, 45(5), 375–390. https://doi.org/10.1287/inte.2015.0804
Simchi-Levi, D., & Simchi-Levi, E. (2020, April 28). We need a stress test for critical supply chains. Harvard Business Review. https://hbr.org/2020/04/we-need-a-stress-test-for-critical-supply-chains
The White House. (2021, October 13). Fact sheet: Biden administration efforts to address bottlenecks at Ports of Los Angeles and Long Beach, moving goods from ship to shelf. The American Presidency Project. https://www.presidency.ucsb.edu/node/352949
Tomlin, B. (2006). On the value of mitigation and contingency strategies for managing supply chain disruption risks. Management Science, 52(5), 639–657. https://doi.org/10.1287/mnsc.1060.0515
UNCTAD. (2024). Navigating troubled waters: Impact to global trade of disruption of shipping routes in the Red Sea, Black Sea and Panama Canal (UNCTAD Rapid Assessment). United Nations Conference on Trade and Development. https://unctad.org/node/44141
U.S. Army Corps of Engineers. (2024, June). U.S. Army Corps of Engineers announces full restoration of Baltimore's Fort McHenry Federal Channel [News release]. Baltimore District. https://www.nab.usace.army.mil/Media/News-Releases/Article/3802402/us-army-corps-of-engineers-announces-full-restoration-of-baltimores-fort-mchenr/
U.S. Department of Commerce. (2022, January 25). Results from semiconductor supply chain request for information. https://www.commerce.gov/news/blog/2022/01/results-semiconductor-supply-chain-request-information
Wieland, A., & Durach, C. F. (2021). Two perspectives on supply chain resilience. Journal of Business Logistics, 42(3), 315–322. https://doi.org/10.1111/jbl.12271
World Bank. (2012). 2011 Thailand floods: Rapid assessment for resilient recovery and reconstruction planning (Overview). The World Bank. https://recovery.preventionweb.net/publication/documents-and-publications/2011-thailand-floods-rapid-assessment-resilient-recovery-and
Videos
Burke, D. (2022, March 4). How to fix broken supply chains [Video]. TED. https://www.youtube.com/watch?v=y_EjCSz1aBo
Harvard Business Review. (2023, January 5). Creating more resilient supply chains (HBR IdeaCast) [Video]. YouTube. https://www.youtube.com/watch?v=tgqwv8Pk0qE
MIT Center for Transportation & Logistics. (2020, May 11). COVID-19: Business and supply chain impacts with Prof. Yossi Sheffi at Crossroads 2020 [Video]. YouTube. https://www.youtube.com/watch?v=KrDMuKHOTMc
MIT Corporate Relations. (2014, October 27). Yossi Sheffi: The resilient enterprise [Video]. YouTube. https://www.youtube.com/watch?v=pKZCUni5gfg
Shih, W. (2020, July 28). What toilet paper can teach us about supply chains [Video]. TEDx Talks. https://www.youtube.com/watch?v=ihd7XJMzdG4