
The last mile is the shortest part of a parcel's journey, and it is the part most likely to break your budget. A box can cross an ocean in a container at low cost per unit, then lose most of its margin in the final few kilometres: hunting for a parking space, walking up a tower block, waiting for a lift, finding nobody home and coming back tomorrow.
For anyone who runs deliveries, plans routes, manages drivers or sets customer promises, the last mile is where strategy meets the street. It is also where many of the loudest claims in logistics are least supported by evidence. Some widely repeated statistics have no traceable origin at all.
So we went back to the sources. We checked more than 50 peer-reviewed studies, official statistics, university lab reports and major industry surveys to collect 25 well-documented facts about last-mile delivery. Each fact comes with the evidence, an APA citation you can check, and three practical steps for leaders who want cheaper, safer and more reliable deliveries.
The short version: The last mile is expensive because of density, parking, buildings, failed attempts and returns, not because of distance. Most customers want cheap and reliable more than they want fast. The best gains come from consolidating stops, fixing the final 50 feet, using the right vehicle for the street, and protecting the people who do the work.
Key takeaways
- Nobody agrees on the last mile's share of cost. Credible estimates range from up to 28% of total delivery cost (Ranieri et al., 2018) to 41% of overall supply chain costs (Capgemini Research Institute, 2019). The popular 53% figure has no primary source we could trace.
- Parcel volume is enormous and still growing. The world shipped 161 billion parcels in 2022 (Pitney Bowes, 2023), and the United States alone handled 23.1 billion in 2025 (Pitney Bowes, 2026).
- Drivers spend 28% of trip time cruising for parking in downtown Seattle (Dalla Chiara & Goodchild, 2020), and walking can take 62% of a London parcel round (Allen et al., 2018).
- A shared parcel locker cut delivery time in a 62-floor tower by 78% and failed deliveries to zero during a pilot (Urban Freight Lab, 2018).
- Most shoppers want the cheapest option. Around 70% preferred the cheapest home delivery, while 20–25% would pay a significant premium for same-day (Joerss et al., 2016).
- Couriers get hurt far more often than average workers. In 2023 the U.S. courier and messenger industry recorded 9.2 injury and illness cases per 100 full-time workers, against 2.4 for private industry overall (U.S. Bureau of Labor Statistics [BLS], 2024a).
How to read this guide: The 25 facts are grouped into four parts. Use the table of contents to jump around. Citations in brackets lead to the full reference list at the bottom. Where a figure comes from an industry survey, a company report or a charity-funded study, we say so in the text. This article is general information, not legal, engineering or financial advice. Check local regulations and your own operating data before making changes.
Part 1: The real economics of the last mile
Fact 1: The famous "53% of costs" statistic has no clear origin, and real estimates vary widely
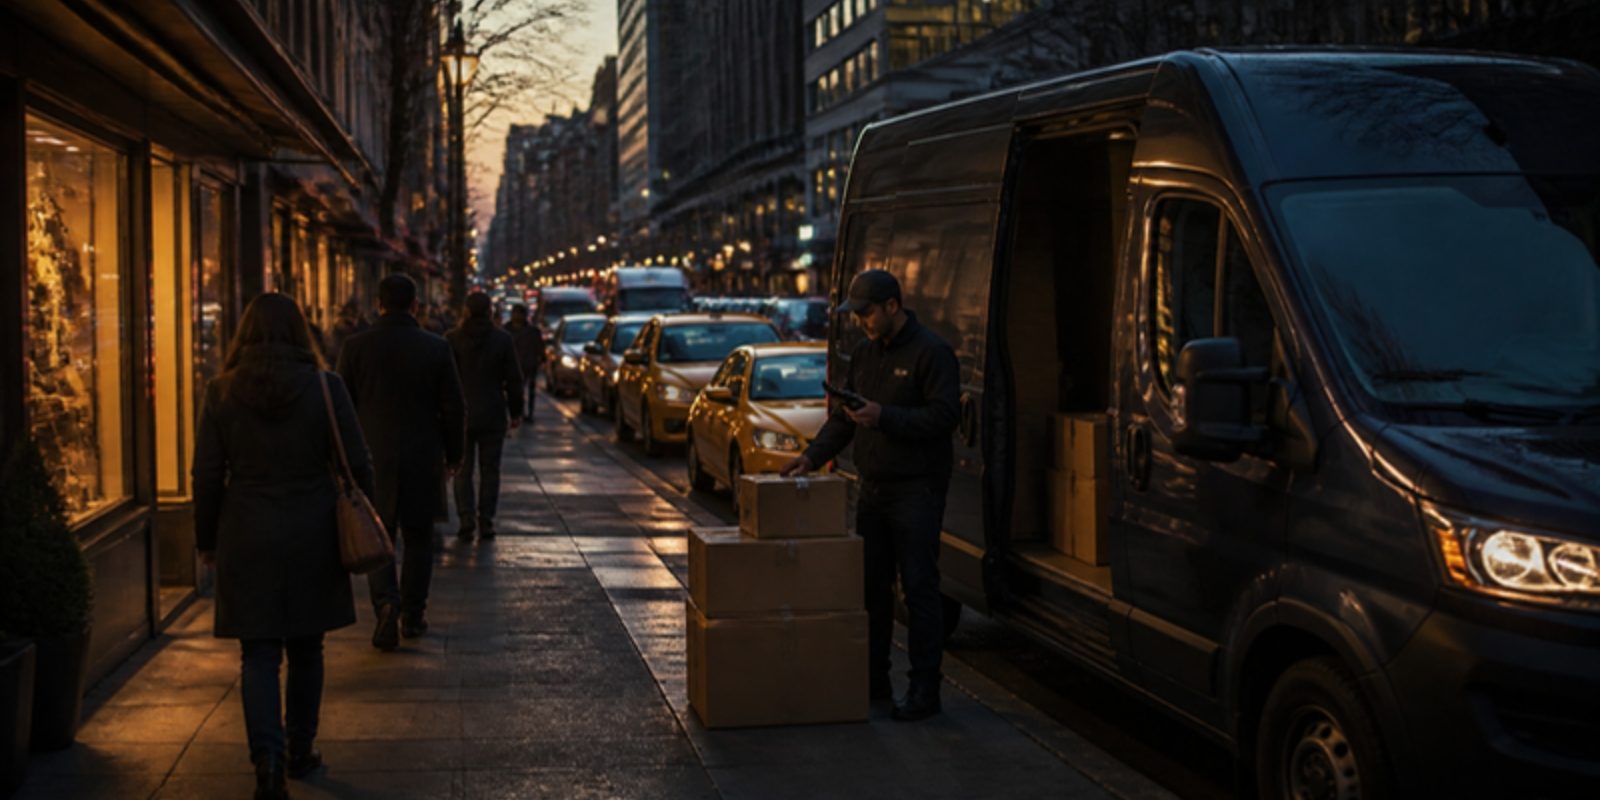
You will often read that the last mile makes up 53% of total shipping or supply chain cost. We could not find a primary study behind that number, so we have left it out. The credible estimates disagree with each other, mostly because they measure different things. A systematic literature review put the last mile at up to 28% of total delivery cost (Ranieri et al., 2018). A Capgemini Research Institute survey of 500 supply chain executives, focused on food and grocery, found last-mile services made up 41% of overall supply chain costs, more than double any other category (Capgemini Research Institute, 2019). McKinsey analysts wrote in 2016 that the last mile's share of total parcel delivery cost often reaches or exceeds 50% (Joerss et al., 2016). Academic researchers describe the business-to-consumer last mile as one of the most expensive, least efficient and most polluting parts of the logistics chain (Gevaers et al., 2014).
What leaders should do:
- Stop quoting a single industry percentage. Calculate your own cost per stop and cost per parcel, split into driving, parking, walking, handover and failed attempts.
- When you see a statistic in a vendor deck, ask for the original study, its sample and its definition of "last mile".
- Track the last mile's share of your own costs every quarter, so you can tell whether changes are actually working.
Fact 2: Most retailers charge customers less than the delivery costs them
Free and cheap delivery is a subsidy. In the Capgemini survey, a last-mile delivery cost organisations an average of $10.10, while customers paid an average of $8.08. Only 1% of the 2,874 consumers surveyed said they would pay the full cost. Nearly all executives (99%) believed online orders were less profitable than in-store orders, by 19% on average, and 97% said they could not sustain free shipping unless automation reduced delivery costs (Capgemini Research Institute, 2019). These are 2018 survey figures from a consultancy, so treat them as a signal of the problem rather than a benchmark for your business.
What leaders should do:
- Know your true cost to serve by order type, region and delivery option, including the cost of failed attempts and returns.
- Use minimum order values, delivery passes or slot pricing to steer demand toward profitable patterns, not just to raise revenue.
- Share real delivery economics with sales and marketing teams before they launch a "free delivery" promotion.
Fact 3: The world now ships well over 150 billion parcels a year
The volume itself is the first reason the last mile is under strain. The Pitney Bowes Parcel Shipping Index, an industry index produced by a shipping company, estimated global parcel volume at 161 billion in 2022, up from 64 billion in 2016. China, the United States and Japan accounted for 87% of that volume, and the index forecast around 225 billion parcels by 2028 (Pitney Bowes, 2023). In the United States, the 2026 edition put 2025 volume at 23.1 billion parcels, up 3.3% on the year, with Amazon Logistics the largest carrier by volume at 6.9 billion parcels (Pitney Bowes, 2026). Online sales keep feeding the flow: e-commerce reached 17.1% of total U.S. retail sales in the second quarter of 2026 (U.S. Census Bureau, 2026).
What leaders should do:
- Plan capacity for growth and for peaks. At UPS, volume between Thanksgiving and Christmas often reaches twice the normal level (Holland et al., 2017), so build flexible labour and vehicle plans in advance.
- Watch carrier market shifts. New entrants and retailer-owned networks are changing prices, service levels and negotiating power.
- Review your carrier mix at least once a year rather than renewing contracts by default.
Fact 4: Without action, the WEF expects 36% more delivery vans in the world's biggest cities by 2030
In January 2020 the World Economic Forum published The Future of the Last-Mile Ecosystem, developed with McKinsey & Company. It projected that demand for last-mile delivery would grow 78% globally by 2030. In a "do nothing" scenario, the number of delivery vehicles in the top 100 cities would rise 36%, delivery emissions would rise 32% (about 6 million additional tonnes of CO2), and congestion would rise by over 21%, adding about 11 minutes to each commuter's day. The report assessed 24 interventions. Its combined "ecosystem" scenario, mixing electric vehicles, night-time deliveries, multi-brand parcel lockers and data-driven re-routing, could cut emissions by 30%, congestion by 30% and delivery costs by 25% compared with doing nothing (World Economic Forum [WEF], 2020). These are model projections, not measured outcomes.
What leaders should do:
- Expect cities to regulate access, kerb space and emissions more tightly. Build those scenarios into fleet and depot plans now.
- Look for interventions that save money and emissions together, such as consolidation and off-peak delivery, so the business case does not depend on goodwill alone.
- Join or start conversations with city transport departments. Operators who share data early tend to shape the rules.
Fact 5: Density, not distance, drives the cost of the last mile
Classic routing research shows that the length of a delivery tour grows roughly with the square root of the number of stops times the area served (Daganzo, 1984). In plain terms, adding stops in the same neighbourhood makes each stop cheaper, while spreading stops thinly makes each one expensive. MIT researchers later tested this "continuum approximation" against real urban road networks. Their data-driven version cut prediction error by 26 percentage points and came within 5–15% of near-optimal routes (Merchán & Winkenbach, 2019). MIT's Matthias Winkenbach has noted that e-commerce home-delivery routes typically run 50 to 150 stops a day, compared with 10 to 15 for beverage distributors serving businesses (Brown, 2018).
What leaders should do:
- Measure stops per hour and parcels per stop, not just miles. Those two numbers explain most last-mile cost differences.
- Design delivery zones and time slots to build density, for example by offering greener or cheaper slots on days you already serve an area.
- Use simple density estimates when planning new depots or service areas, before investing in full simulation.
Fact 6: Most customers want cheap delivery, not the fastest delivery
The industry often acts as if every customer wants their parcel within hours. The evidence says otherwise. McKinsey surveyed more than 4,700 consumers in China, Germany and the United States in 2016. About 70% preferred the cheapest home delivery option. Between 20% and 25% would pay a significant premium for same-day delivery, of up to about 3 euros or 3 dollars, but only about 2% would pay much more than that for instant delivery (Joerss et al., 2016). Speed still matters to a minority: up to 27% said they had decided not to buy something online because delivery took too long. Capgemini's later survey found 55% of consumers said they would switch to a competitor offering faster delivery, so expectations can shift (Capgemini Research Institute, 2019).
What leaders should do:
- Segment your customers. Offer premium speed to those who will pay for it, and a reliable, low-cost default for everyone else.
- Promise reliability before speed. A delivery that arrives exactly when promised usually beats a faster promise that is often missed.
- Test willingness to pay with real choices at checkout, not just survey questions.
Fact 7: Online shopping is not automatically greener than going to the shop
Whether e-commerce cuts or raises emissions depends on how people shop. An early UK analysis found that, on average, home delivery was likely to generate less CO2 than a typical car shopping trip, though bus trips for several items could match it (Edwards, McKinnon, & Cullinane, 2010). A later stochastic model of UK grocery-type goods found that "bricks and clicks" (ordering online and fulfilling through a physical store) most likely cut greenhouse gas footprints, while pure online players with parcel delivery often had higher footprints than traditional shopping. The number of items bought and the last-mile travel distance drove most of the variation (Shahmohammadi et al., 2020). Researchers also warn that comparisons depend heavily on where the boundaries of the analysis are drawn (Edwards et al., 2011).
What leaders should do:
- Be careful with "green delivery" claims. Base them on your own data and a clear method, not on general statements.
- Encourage larger, combined orders through basket thresholds and order bundling.
- Use store networks as fulfilment and collection points where you have them. They can be both cheaper and lower-carbon.
Fact 8: Rush deliveries and small baskets erode the environmental case for e-commerce
Speed has a hidden cost. Jaller and Pahwa (2020) combined U.S. time-use data with travel models for Dallas and San Francisco and ran a breakeven analysis between in-store and online shopping. Their results showed that rush deliveries, basket size and consolidation levels decide whether online shopping beats a trip to the shop. Fast delivery leaves less time to group orders, so vans run emptier and more trips are needed. Shahmohammadi et al. (2020) found that replacing delivery vans with electric cargo bikes could cut the greenhouse gas footprint of parcel delivery by 26%, showing that vehicle choice also matters.
What leaders should do:
- Make the slower, consolidated option the easy default at checkout and explain its benefits clearly.
- Track average parcels per stop and vehicle fill rate for express services separately from standard services.
- Price express delivery to reflect its real cost, and reserve it for customers and products that genuinely need it.
Part 2: The final 50 feet, where time and money disappear
Fact 9: Delivery drivers spend 28% of their trip time hunting for parking
Researchers at the University of Washington's Urban Freight Lab analysed GPS data from about 2,900 parcel delivery trips in downtown Seattle. Drivers spent an estimated 2.3 minutes per trip cruising for parking, which was 28% of total trip time on average. Cruising fell where more kerb space was set aside for commercial load zones and paid parking, and where more off-street parking was available. It rose where more kerb space went to bus zones (Dalla Chiara & Goodchild, 2020). In a follow-up controlled experiment, giving drivers real-time kerb availability information through a mobile app cut their cruising time by 27.9% and their cruising distance by 12.4% (Dalla Chiara et al., 2022).
What leaders should do:
- Map where your drivers actually park on dense routes, and plan stops around reliable loading spaces rather than the doorstep.
- Work with city authorities on loading zones, bookable kerb space and freight parking rules in your busiest areas.
- Pilot parking and kerb-availability data in routing tools, and measure the time saved.
Fact 10: In dense cities, a parcel driver can spend more time walking than driving
A study of parcel delivery operations in central London found that walking accounted for 62% of the total vehicle round time and 40% of the total round distance (Allen et al., 2018). The van often acts as a mobile storeroom while the driver carries parcels on foot between buildings. The study also highlighted pressures that make the job harder: seasonal peaks, shorter lead times between order and delivery, delivery time windows, first-time delivery failures and high volumes of returns. At the same time, cities are redesigning streets in favour of walking, cycling and public transport, which reduces kerbside access for vans.
What leaders should do:
- Plan dense urban routes as "park and walk" loops, and equip drivers with good trolleys and bags.
- Count walking time in workload and route planning. A route that looks short on a map may be exhausting on foot.
- Consider whether a cargo bike or walker-plus-hub model would suit routes where the van mostly sits parked.
Fact 11: Inside a tower block, a shared locker cut delivery time by 78%
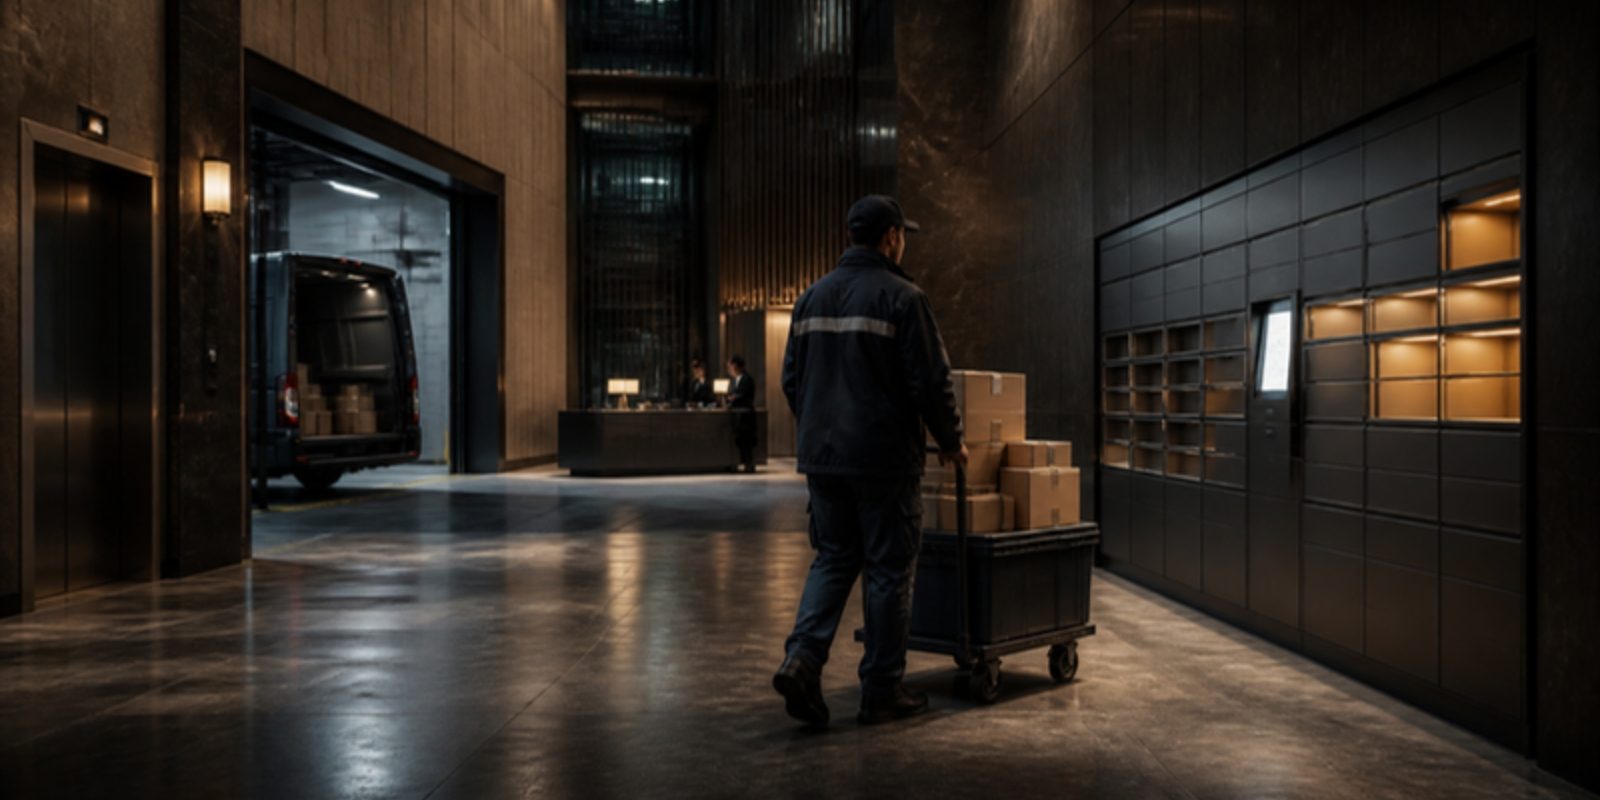
The "final 50 feet" begins when a truck parks and ends when the customer receives the goods. In earlier Urban Freight Lab research, drivers spent an average of 20 minutes inside the 62-floor Seattle Municipal Tower, of which 12.2 minutes went on moving floor to floor in freight lifts and door to door. In a 2018 pilot, the lab installed a common carrier locker that any carrier could use, near the loading bay. A locker delivery took 5.6 minutes, a 78% reduction compared with door-to-door delivery. Over 20 days, 7 of 545 parcels delivered door to door failed, while there were zero failed deliveries to the locker (Urban Freight Lab, 2018). The researchers stress that 78% was a best-case example, comparing one locker visit with eight door-to-door deliveries, and should not be expected for every building.
What leaders should do:
- Identify your highest-volume buildings and ask how parcels move after they reach the loading bay.
- Propose shared lockers, mailrooms or concierge drop points to building managers, with your delivery data as evidence.
- Measure dwell time at the loading bay before and after any change, so you can show the benefit to partners.
Fact 12: A failed delivery costs twice, and the customer often pays the bigger carbon bill
The Urban Freight Lab notes that the rate of failed first delivery attempts can reach 15% in some cities (Urban Freight Lab, 2018). A UK carbon-audit study modelled a typical van round of 120 drops and found that a second delivery attempt added 9% to 75% to emissions per drop, depending on the failure rate. Strikingly, 85% to 95% of the emissions from a traditional failed delivery came not from the repeat van trip but from customers travelling to the carrier's depot to collect their parcel (Edwards, McKinnon, Cherrett, et al., 2010). A related study found that networks of collection and delivery points worked best where first-time failures exceeded 20%, and could cut customers' travel costs by up to 90% (Song et al., 2009).
What leaders should do:
- Measure your first-time delivery success rate by area, building type and time of day, and set a target for it.
- Send accurate arrival windows and simple options to redirect, reschedule or choose a safe place before the driver sets off.
- Offer nearby pickup points so a failed attempt does not turn into a long drive to a depot.
Fact 13: Lockers help carriers, but customers still prefer their doorstep
Lockers and pickup points consolidate many deliveries into one stop. Winkenbach has argued that neighbourhood lockers can reduce the risk of failed delivery to almost zero while lowering costs (Brown, 2018), and researchers have studied large locker networks such as InPost's in Poland as an efficient last-mile option (Iwan et al., 2016). The WEF (2020) included multi-brand lockers, which several carriers share, in its best-performing scenario. But customers need persuading. In McKinsey's survey, only a minority would opt for unattended delivery such as lockers, even at discounted prices. About half said they would prefer a locker only if home delivery cost around 3 euros or 3 dollars more (Joerss et al., 2016).
What leaders should do:
- Put lockers where people already go, such as stations, supermarkets and workplaces, not where land is cheapest.
- Give customers a real reason to choose them: a lower price, later cut-off times or guaranteed availability.
- Favour open, multi-carrier lockers where possible. Shared sites build density faster than one brand's network.
Fact 14: Shifting deliveries to the night can save a city hundreds of millions of dollars
In a New York City pilot, 33 companies in Manhattan switched their deliveries to off-hours, between 7 p.m. and 6 a.m., for one month. The programme paid financial incentives to the businesses receiving the goods, rather than charging carriers, and used GPS tracking to verify deliveries. Participants reported being very satisfied. The researchers estimated that a full off-hour delivery programme would bring economic benefits of $147 million to $193 million a year, from faster travel for daytime traffic, lower pollution and higher freight productivity. Almost all participants who received unassisted deliveries, with no staff present at the receiving site, kept receiving off-hour deliveries after the incentive ended (Holguín-Veras et al., 2011, 2014).
What leaders should do:
- Identify customers, such as shops, restaurants and offices, that could accept unassisted deliveries at night through secure access.
- Check noise rules, driver welfare and security before you start, and use quiet equipment and trained crews.
- Run a time-limited pilot with a few willing receivers and measure travel times, stops per hour and complaints.
Fact 15: Returns are a second last mile, worth about $850 billion a year in the U.S.
Every delivery promise carries a return promise. The National Retail Federation and Happy Returns, a UPS company, estimated that U.S. consumers would return $849.9 billion of merchandise in 2025, about 15.8% of annual retail sales, down from $890 billion (16.9%) in 2024. Retailers expected 19.3% of online sales to come back, and estimated that 9% of all returns were fraudulent (National Retail Federation [NRF], 2025). These figures come from industry surveys of 2,006 consumers and 358 e-commerce professionals. Academic research adds that returns processes are usually complicated, prone to fraud and inefficient, and that returns data are often not systematically collected or reported to senior management (Frei et al., 2020).
What leaders should do:
- Report returns volume, cost and reasons to senior leaders monthly, alongside outbound delivery metrics.
- Consolidate returns through drop-off points and lockers rather than individual home collections where you can.
- Fix the root causes, such as poor sizing information or damaged goods, which cost less than handling the return.
Part 3: The new toolkit: algorithms, bikes, hubs and robots
Fact 16: Route optimisation is a 1959 maths problem that still saves hundreds of millions of dollars
The vehicle routing problem was first formulated by George Dantzig and John Ramser in 1959, to route a fleet of petrol delivery trucks between a terminal and many service stations at minimum total mileage (Dantzig & Ramser, 1959). Sixty years of research later, it pays off at scale. UPS built a system called ORION that plans an optimised route every day for each of its 55,000 U.S. drivers, who each make about 140 to 160 stops. It cost about $295 million to build and deploy. UPS expected it to save $300 million to $400 million a year, cut 100 million miles of driving and reduce CO2 emissions by 100,000 metric tons annually (Holland et al., 2017). The authors were candid that the system is not perfect: some drivers can still beat it, and a small share of drivers and managers did not like it.
What leaders should do:
- If you still plan routes by hand or by habit, test optimisation software on a sample of routes and compare results honestly.
- Involve experienced drivers in setting up the system. Their local knowledge catches problems the algorithm misses.
- Budget for change management and training, not just software. UPS took nearly 10 years to build and deploy ORION.
Fact 17: Cargo bikes can beat vans in city centres, within limits
A University of Westminster report, funded by the climate charity Possible and based on GPS data from 13,735 pick-up and delivery locations of the London cargo bike company Pedal Me, found that its cargo bikes completed the work an average of 1.61 times faster than vans would have. Compared with diesel vans, the bikes saved about 90% of CO2 emissions (Verlinghieri et al., 2021). Because the data came from one company and the study was charity-funded, treat the results as promising rather than universal. Peer-reviewed simulations add important limits. In Porto, cargo bikes could replace up to 10% of conventional vans in areas with maximum linear distances of about 2 km without changing overall network efficiency (Melo & Baptista, 2017). In a German simulation, large parcels meant at least half of deliveries still needed vans (Llorca & Moeckel, 2021). Researchers also found that whether couriers adopt electric cargo bikes depends on their own attitudes and working practices, since many freelance messengers choose their own vehicles (Gruber et al., 2014).
What leaders should do:
- Start with dense, short-distance, small-parcel routes, where bikes have the clearest advantage.
- Keep vans or feeder vehicles for heavy and bulky items, and design the two to work together.
- Involve riders in choosing equipment and routes, and invest in their safety training and secure parking.
Fact 18: Microhubs work best as small, local, shared spaces, not big consolidation centres
Cities have tried large urban consolidation centres for decades, and many have failed. That does not mean small local hubs are a bad idea. Katsela et al. (2022) analysed 17 microhub cases in Europe and North America and built a common framework for describing their different types. They see microhubs as an important opportunity to improve urban freight efficiency and sustainability, and as a step toward the multi-sector collaboration that urban freight needs. The WEF (2020) found that consolidating the very last mile, through lockers and shared drop points, was less disruptive for logistics companies than consolidating the second-to-last mile through large centres. Reviews of city logistics point to the same challenge: success depends on coordinating many stakeholders, not just on the building (Savelsbergh & Van Woensel, 2016).
What leaders should do:
- Look for underused space close to your densest delivery areas, such as car parks, store back rooms or railway arches.
- Agree clear rules early if several companies share a hub: access, costs, data and liability.
- Measure the whole chain, including the extra handling and feeder trips a hub adds, not just the final leg.
Fact 19: Crowdsourced delivery can cut costs, but it is not automatically greener or safer
Crowdsourced delivery uses ordinary people, travelling anyway, to carry parcels for a fee. Operations researchers showed that using "occasional drivers" can reduce delivery costs substantially, but found that designing the right payment scheme was harder than expected, because pay affects how many drivers take part and how far they will detour (Archetti et al., 2016). A traffic simulation of central Rome found that crowdsourced deliveries by car generally had higher negative impacts than deliveries by people using public transport, and that detour length and parking behaviour mattered a great deal (Simoni et al., 2020). Reviews highlight barriers around trust, safety and security (Le et al., 2019) and show that the sustainability of crowd logistics depends on how each scheme is designed (Buldeo Rai et al., 2017). One Rome study explored a transit-based model, with lockers in or near stations, as a more sustainable option (Gatta et al., 2019).
What leaders should do:
- Use crowdsourced capacity for genuine overflow and on-the-way trips, not as a replacement for planned, consolidated routes.
- Limit detours and favour walking, cycling and public transport carriers in dense areas.
- Check insurance, vetting, data protection and worker classification rules before launching.
Fact 20: Drones only beat trucks on carbon for small parcels and short hops
A study in Nature Communications found that small multi-rotor drones had a practical range of about 4 km with current batteries, so they would need a new network of urban warehouses or waystations. Drones use less energy per package-kilometre than trucks, but the extra warehouses and longer distances per package raise their life-cycle impacts (Stolaroff et al., 2018a). After a published correction, the base case showed a small drone delivering a 0.5 kg package cut greenhouse gases compared with a diesel truck by 54% in California and 23% in Missouri. For a medium-sized 8 kg package, emissions were about 24% higher than truck delivery on the average U.S. electricity mix (Stolaroff et al., 2018b). In short, drones may suit light, urgent items, ideally with clean electricity, but they are not a general replacement for vans.
What leaders should do:
- Limit drone pilots to small, high-value or urgent items, such as medical supplies, where speed has real value.
- Include the whole system in the business case: hubs, batteries, charging, airspace rules and staff.
- Ask suppliers for independent life-cycle evidence for your parcel sizes and local electricity mix.
Fact 21: Forecasts of an autonomous last mile keep arriving early
In 2016, McKinsey analysts predicted that autonomous vehicles, including drones and autonomous ground vehicles with lockers, would deliver about 80% of all parcels within about ten years (Joerss et al., 2016). Ten years later, human drivers still deliver most of the world's parcels. Executives were sceptical even then: in 2018, 95% of the executives Capgemini surveyed called drone delivery an impractical fad (Capgemini Research Institute, 2019). The research is more measured. Sidewalk delivery robots launched from a special van can provide substantial cost and time savings in some scenarios and may reduce road travel per package (Jennings & Figliozzi, 2019), with potential to cut urban energy use and CO2 (Figliozzi & Jennings, 2020). A major operational research survey shows these concepts bring many new planning problems, such as how robots, drones and vans must be scheduled together (Boysen et al., 2021).
What leaders should do:
- Treat bold technology forecasts as scenarios, not plans. Check what has actually been deployed at scale.
- Run small, measured pilots with clear success criteria, such as cost per stop, safety incidents and customer complaints.
- Keep investing in the basics, such as density, parking and first-time success, which pay off whatever technology wins.
Fact 22: In emerging megacities, the last mile runs through millions of tiny shops
Much of the world's last mile does not end at a front door. It ends at a small family-run shop. Researchers at MIT and partner universities estimate there are about 50 million of these "nanostores" worldwide and argue that serving them is one of the central distribution challenges in emerging megacities (Fransoo & Blanco, 2017). Deliveries to nanostores are frequent and small, often in congested streets with little parking. Winkenbach has described riding on half-empty delivery trucks in Mexico City from several consumer goods companies that served the same shops at the same times (Brown, 2018). That duplication is an opportunity for collaboration and consolidation.
What leaders should do:
- If you supply traditional retail, measure truck fill rates and drops per route, and look for duplicated routes.
- Explore shared distribution with non-competing suppliers serving the same shops.
- Design vehicles, order systems and payment methods around the shopkeeper's reality, not a supermarket model.
Part 4: The people who make the last mile work
Fact 23: Couriers are injured at nearly four times the private-industry rate
Last-mile work is physically hard: lifting, carrying, climbing stairs, getting in and out of vehicles and working in all weathers. In 2023, the U.S. couriers and messengers industry reported 77,000 injury and illness cases, 29.0% of all cases in transportation and warehousing. That was a rate of 9.2 cases per 100 full-time equivalent workers, against 2.4 for private industry as a whole (BLS, 2024a). The industry also recorded 57 fatal work injuries in 2023 (BLS, n.d.). These are employer-reported figures, and they may not capture self-employed couriers or platform workers.
What leaders should do:
- Analyse your own injury data by task, such as lifting, stairs, vehicle steps and slips, and target the top causes first.
- Use equipment that reduces strain, such as trolleys, step designs, load limits and well-organised vehicle shelving.
- Build realistic stop counts into routes. Fatigue and rushing are common routes to injury.
Fact 24: Transportation work is the deadliest occupational group in the United States
In 2023, workers in transportation and material moving occupations suffered 1,495 fatal injuries, more than any other occupational group, at a rate of 13.6 deaths per 100,000 full-time equivalent workers. The rate for all workers was 3.5. Across all jobs, transportation incidents were the most common type of fatal event, accounting for 36.8% (1,942) of all 5,283 workplace deaths (BLS, 2024b). Not all of these deaths are in last-mile delivery, but the road is the main hazard for everyone who drives for work.
What leaders should do:
- Treat driving as a core safety risk, with clear policies on phone use, fatigue, speed and seat belts.
- Use vehicle data to coach drivers, not just to discipline them, and recognise safe driving publicly.
- Investigate near misses as well as crashes. They show you where the next serious incident is likely to happen.
Fact 25: Gig delivery work brings its own risks, and time pressure is at the heart of them
The International Labour Organization reports that the number of digital labour platforms grew fivefold worldwide between 2010 and 2020, including location-based platforms used by delivery workers (International Labour Organization [ILO], 2021). Safety research is catching up. In a UK study of people who drive for work in the gig economy, with 48 interviews and 231 survey responses, 42% said they had been in a collision that damaged their vehicle, 10% said someone had been injured, usually themselves, and 75% had had to take action to avoid a collision while working. Couriers described fatigue, pressure to break speed limits and using their phones while driving (Christie & Ward, 2019). A study of 431 food delivery riders found that delivery time restrictions push riders into traffic violations, with surrounding traffic the strongest predictor of crash risk (Khan & Velaga, 2024).
What leaders should do:
- Remove incentives that reward speed over safety, such as penalties for late delivery that ignore traffic conditions.
- Give every rider and driver, whether employed or contracted, basic safety training, protective equipment and a way to report hazards.
- Check that apps never require drivers to tap screens while moving, and design routes and messages for hands-free use.
A final thought for leaders: the delivery promise is written in an office but kept on the street. Capgemini found that 43% of supply chain executives saw a tight labour market and rising wages as a major challenge for last-mile delivery (Capgemini Research Institute, 2019). Every new time window, cut-off and service level you agree changes what drivers face at the kerb. Involve the people who do the work before you change the promise.
Your 10-point last-mile action plan
You do not need drones or robots to improve your last mile. Across all 25 facts, the same practical moves come up again and again:
- Know your own numbers. Measure cost per stop, stops per hour, parcels per stop and first-time success. Ignore untraceable industry percentages.
- Build density deliberately. Use zones, slots and pricing to put more stops on the same streets.
- Sell reliability before speed. Make a dependable, low-cost option the default, and price express delivery honestly.
- Fix the final 50 feet. Work with building managers and cities on loading space, lockers and mailrooms.
- Attack failed deliveries. Give accurate arrival windows, easy redirection and nearby pickup points.
- Use the right vehicle for the street. Mix vans, cargo bikes and walkers based on parcel size and density.
- Route with data and drivers. Optimisation software works best with experienced drivers' local knowledge.
- Manage returns as a second last mile. Report them to senior leaders and consolidate them through drop-off points.
- Pilot technology with clear tests. Judge drones, robots and crowdsourcing on measured cost, safety and emissions.
- Protect the people. Design routes, incentives and apps so that no one has to choose between safety and the deadline.
Ready to lead the last mile with confidence? Explore BLTI's logistics, transportation and operations credentials to build the skills to run safer, leaner delivery operations, and take our free Leadership Flex Check to see how you lead your team under pressure.
Frequently asked questions
What is last-mile delivery?
Last-mile delivery is the final stage of a product's journey, from a local depot, store or hub to the customer's door, locker or pickup point. It includes driving, parking, walking, handing over the goods and dealing with failed attempts. Researchers describe it as one of the most expensive, least efficient and most polluting parts of the logistics chain (Gevaers et al., 2014).
What percentage of delivery cost is the last mile?
There is no single reliable figure. A systematic review put it at up to 28% of total delivery cost (Ranieri et al., 2018), a 2018 executive survey put it at 41% of overall supply chain costs (Capgemini Research Institute, 2019), and McKinsey wrote that it often reaches or exceeds 50% of parcel delivery cost (Joerss et al., 2016). The often-quoted 53% figure does not have a primary source we could verify.
Why is last-mile delivery so expensive?
Because each stop usually carries only one or a few parcels, and much of the time is spent not driving: searching for parking, walking, waiting for lifts and handling failed deliveries. In Seattle, cruising for parking took 28% of trip time (Dalla Chiara & Goodchild, 2020), and in central London walking took 62% of round time (Allen et al., 2018).
Are parcel lockers better than home delivery?
For carriers, often yes. A Seattle pilot cut delivery time inside a tower by 78% and failed deliveries to zero (Urban Freight Lab, 2018). For customers, lockers need to be convenient or cheaper, because many people still prefer delivery to their door (Joerss et al., 2016).
Is online shopping better for the environment than going to the shop?
It depends. Home delivery can produce less CO2 than a typical car shopping trip (Edwards, McKinnon, & Cullinane, 2010), but small baskets, rush deliveries and pure online parcel models can make it worse (Jaller & Pahwa, 2020; Shahmohammadi et al., 2020). Consolidated orders and store-based fulfilment usually perform best.
Do cargo bikes really work for deliveries?
In dense city centres and for smaller parcels, evidence suggests they can be faster and far cleaner than vans (Verlinghieri et al., 2021). Peer-reviewed simulations show limits: large parcels still need vans, and bikes work best over short distances (Llorca & Moeckel, 2021; Melo & Baptista, 2017).
About this research
This guide was compiled by the Better Leaders Training Institute (BLTI) research team. Every source below was checked for authors, year, title, publisher and DOI or stable link, using publisher records, the Crossref database and the original reports wherever they were available. We prioritised peer-reviewed studies, official government statistics and university research labs, and used major industry surveys where no independent data existed. Where a figure comes from a consultancy survey, an industry index, a company report or a charity-funded study, we say so in the text. We left out widely repeated figures, such as the claim that the last mile is 53% of costs, when we could not trace them to a credible original source. Findings from individual studies describe specific cities, samples and years; your operation may differ. This article is general information, not legal, engineering, safety or financial advice.
References
Allen, J., Piecyk, M., Piotrowska, M., McLeod, F., Cherrett, T., Ghali, K., Nguyen, T., Bektas, T., Bates, O., Friday, A., Wise, S., & Austwick, M. (2018). Understanding the impact of e-commerce on last-mile light goods vehicle activity in urban areas: The case of London. Transportation Research Part D: Transport and Environment, 61, 325–338. https://doi.org/10.1016/j.trd.2017.07.020
Archetti, C., Savelsbergh, M., & Speranza, M. G. (2016). The vehicle routing problem with occasional drivers. European Journal of Operational Research, 254(2), 472–480. https://doi.org/10.1016/j.ejor.2016.03.049
Boysen, N., Fedtke, S., & Schwerdfeger, S. (2021). Last-mile delivery concepts: A survey from an operational research perspective. OR Spectrum, 43(1), 1–58. https://doi.org/10.1007/s00291-020-00607-8
Brown, E. (2018, September 4). E-commerce spurs innovation in last-mile logistics. MIT News. https://news.mit.edu/2018/mit-e-commerce-spurs-innovations-last-mile-logistics-0904
Buldeo Rai, H., Verlinde, S., Merckx, J., & Macharis, C. (2017). Crowd logistics: An opportunity for more sustainable urban freight transport? European Transport Research Review, 9(3), Article 39. https://doi.org/10.1007/s12544-017-0256-6
Capgemini Research Institute. (2019). The last-mile delivery challenge: Giving retail and consumer product customers a superior delivery experience without impacting profitability. Capgemini. https://www.capgemini.com/wp-content/uploads/2019/01/Report-Digital-%E2%80%93-Last-Mile-Delivery-Challenge1.pdf
Christie, N., & Ward, H. (2019). The health and safety risks for people who drive for work in the gig economy. Journal of Transport & Health, 13, 115–127. https://doi.org/10.1016/j.jth.2019.02.007
Daganzo, C. F. (1984). The length of tours in zones of different shapes. Transportation Research Part B: Methodological, 18(2), 135–145. https://doi.org/10.1016/0191-2615(84)90027-4
Dalla Chiara, G., & Goodchild, A. (2020). Do commercial vehicles cruise for parking? Empirical evidence from Seattle. Transport Policy, 97, 26–36. https://doi.org/10.1016/j.tranpol.2020.06.013
Dalla Chiara, G., Krutein, K. F., Ranjbari, A., & Goodchild, A. (2022). Providing curb availability information to delivery drivers reduces cruising for parking. Scientific Reports, 12, Article 19355. https://doi.org/10.1038/s41598-022-23987-z
Dantzig, G. B., & Ramser, J. H. (1959). The truck dispatching problem. Management Science, 6(1), 80–91. https://doi.org/10.1287/mnsc.6.1.80
Edwards, J., McKinnon, A., Cherrett, T., McLeod, F., & Song, L. (2010). Carbon dioxide benefits of using collection–delivery points for failed home deliveries in the United Kingdom. Transportation Research Record: Journal of the Transportation Research Board, 2191(1), 136–143. https://doi.org/10.3141/2191-17
Edwards, J., McKinnon, A., & Cullinane, S. (2011). Comparative carbon auditing of conventional and online retail supply chains: A review of methodological issues. Supply Chain Management: An International Journal, 16(1), 57–63. https://doi.org/10.1108/13598541111103502
Edwards, J. B., McKinnon, A. C., & Cullinane, S. L. (2010). Comparative analysis of the carbon footprints of conventional and online retailing. International Journal of Physical Distribution & Logistics Management, 40(1/2), 103–123. https://doi.org/10.1108/09600031011018055
Figliozzi, M., & Jennings, D. (2020). Autonomous delivery robots and their potential impacts on urban freight energy consumption and emissions. Transportation Research Procedia, 46, 21–28. https://doi.org/10.1016/j.trpro.2020.03.159
Fransoo, J. C., & Blanco, E. E. (2017). 50 million nanostores. In J. C. Fransoo, E. E. Blanco, & C. Mejia-Argueta (Eds.), Reaching 50 million nanostores: Retail distribution in emerging megacities (pp. 3–17). CreateSpace Independent Publishing Platform.
Frei, R., Jack, L., & Brown, S. (2020). Product returns: A growing problem for business, society and environment. International Journal of Operations & Production Management, 40(10), 1613–1621. https://doi.org/10.1108/IJOPM-02-2020-0083
Gatta, V., Marcucci, E., Nigro, M., Patella, S. M., & Serafini, S. (2019). Public transport-based crowdshipping for sustainable city logistics: Assessing economic and environmental impacts. Sustainability, 11(1), Article 145. https://doi.org/10.3390/su11010145
Gevaers, R., Van de Voorde, E., & Vanelslander, T. (2011). Characteristics and typology of last-mile logistics from an innovation perspective in an urban context. In City distribution and urban freight transport. Edward Elgar. https://doi.org/10.4337/9780857932754.00009
Gevaers, R., Van de Voorde, E., & Vanelslander, T. (2014). Cost modelling and simulation of last-mile characteristics in an innovative B2C supply chain environment with implications on urban areas and cities. Procedia - Social and Behavioral Sciences, 125, 398–411. https://doi.org/10.1016/j.sbspro.2014.01.1483
Gruber, J., Kihm, A., & Lenz, B. (2014). A new vehicle for urban freight? An ex-ante evaluation of electric cargo bikes in courier services. Research in Transportation Business & Management, 11, 53–62. https://doi.org/10.1016/j.rtbm.2014.03.004
Holguín-Veras, J., Ozbay, K., Kornhauser, A., Brom, M. A., Iyer, S., Yushimito, W. F., Ukkusuri, S., Allen, B., & Silas, M. A. (2011). Overall impacts of off-hour delivery programs in New York City metropolitan area. Transportation Research Record: Journal of the Transportation Research Board, 2238(1), 68–76. https://doi.org/10.3141/2238-09
Holguín-Veras, J., Wang, C., Browne, M., Hodge, S. D., & Wojtowicz, J. (2014). The New York City off-hour delivery project: Lessons for city logistics. Procedia - Social and Behavioral Sciences, 125, 36–48. https://doi.org/10.1016/j.sbspro.2014.01.1454
Holland, C., Levis, J., Nuggehalli, R., Santilli, B., & Winters, J. (2017). UPS optimizes delivery routes. Interfaces, 47(1), 8–23. https://doi.org/10.1287/inte.2016.0875
International Labour Organization. (2021). World employment and social outlook 2021: The role of digital labour platforms in transforming the world of work. https://www.ilo.org/global/research/global-reports/weso/2021/WCMS_771749/lang--en/index.htm
Iwan, S., Kijewska, K., & Lemke, J. (2016). Analysis of parcel lockers' efficiency as the last mile delivery solution: The results of the research in Poland. Transportation Research Procedia, 12, 644–655. https://doi.org/10.1016/j.trpro.2016.02.018
Jaller, M., & Pahwa, A. (2020). Evaluating the environmental impacts of online shopping: A behavioral and transportation approach. Transportation Research Part D: Transport and Environment, 80, Article 102223. https://doi.org/10.1016/j.trd.2020.102223
Jennings, D., & Figliozzi, M. (2019). Study of sidewalk autonomous delivery robots and their potential impacts on freight efficiency and travel. Transportation Research Record: Journal of the Transportation Research Board, 2673(6), 317–326. https://doi.org/10.1177/0361198119849398
Joerss, M., Schröder, J., Neuhaus, F., Klink, C., & Mann, F. (2016). Parcel delivery: The future of last mile. McKinsey & Company. https://karriere.mckinsey.de/~/media/mckinsey/industries/travel%20logistics%20and%20infrastructure/our%20insights/how%20customer%20demands%20are%20reshaping%20last%20mile%20delivery/parcel_delivery_the_future_of_last_mile.pdf
Katsela, K., Güneş, Ş., Fried, T., Goodchild, A., & Browne, M. (2022). Defining urban freight microhubs: A case study analysis. Sustainability, 14(1), Article 532. https://doi.org/10.3390/su14010532
Khan, T., & Velaga, N. R. (2024). Evaluating the crash risk and traffic offenses of motorized two-wheelers: A study specific to food delivery riders. Transportation Research Record: Journal of the Transportation Research Board, 2679(3), 759–777. https://doi.org/10.1177/03611981241283452
Le, T. V., Stathopoulos, A., Van Woensel, T., & Ukkusuri, S. V. (2019). Supply, demand, operations, and management of crowd-shipping services: A review and empirical evidence. Transportation Research Part C: Emerging Technologies, 103, 83–103. https://doi.org/10.1016/j.trc.2019.03.023
Llorca, C., & Moeckel, R. (2021). Assesment of the potential of cargo bikes and electrification for last-mile parcel delivery by means of simulation of urban freight flows. European Transport Research Review, 13(1), Article 33. https://doi.org/10.1186/s12544-021-00491-5
Melo, S., & Baptista, P. (2017). Evaluating the impacts of using cargo cycles on urban logistics: Integrating traffic, environmental and operational boundaries. European Transport Research Review, 9(2), Article 30. https://doi.org/10.1007/s12544-017-0246-8
Merchán, D., & Winkenbach, M. (2019). An empirical validation and data-driven extension of continuum approximation approaches for urban route distances. Networks, 73(4), 418–433. https://doi.org/10.1002/net.21874
National Retail Federation. (2025, October 15). Consumers expected to return nearly $850 billion in merchandise in 2025 [Press release]. https://nrf.com/media-center/press-releases/consumers-expected-to-return-nearly-850-billion-in-merchandise-in-2025
Pitney Bowes. (2023, August 9). Pitney Bowes Parcel Shipping Index confirms extended effects of COVID-19 lockdowns on Chinese shipping through 2022 [Press release]. Business Wire. https://www.businesswire.com/news/home/20230809471409/en/Pitney-Bowes-Parcel-Shipping-Index-Confirms-Extended-Effects-of-COVID-19-Lockdowns-on-Chinese-Shipping-Through-2022
Pitney Bowes. (2026). Pitney Bowes Parcel Shipping Index 2026. https://www.pitneybowes.com/us/shipping-index.html
Ranieri, L., Digiesi, S., Silvestri, B., & Roccotelli, M. (2018). A review of last mile logistics innovations in an externalities cost reduction vision. Sustainability, 10(3), Article 782. https://doi.org/10.3390/su10030782
Savelsbergh, M., & Van Woensel, T. (2016). City logistics: Challenges and opportunities. Transportation Science, 50(2), 579–590. https://doi.org/10.1287/trsc.2016.0675
Shahmohammadi, S., Steinmann, Z. J. N., Tambjerg, L., van Loon, P., King, J. M. H., & Huijbregts, M. A. J. (2020). Comparative greenhouse gas footprinting of online versus traditional shopping for fast-moving consumer goods: A stochastic approach. Environmental Science & Technology, 54(6), 3499–3509. https://doi.org/10.1021/acs.est.9b06252
Simoni, M. D., Marcucci, E., Gatta, V., & Claudel, C. G. (2020). Potential last-mile impacts of crowdshipping services: A simulation-based evaluation. Transportation, 47(4), 1933–1954. https://doi.org/10.1007/s11116-019-10028-4
Song, L., Cherrett, T., McLeod, F., & Guan, W. (2009). Addressing the last mile problem: Transport impacts of collection and delivery points. Transportation Research Record: Journal of the Transportation Research Board, 2097(1), 9–18. https://doi.org/10.3141/2097-02
Stolaroff, J. K., Samaras, C., O'Neill, E. R., Lubers, A., Mitchell, A. S., & Ceperley, D. (2018a). Energy use and life cycle greenhouse gas emissions of drones for commercial package delivery. Nature Communications, 9, Article 409. https://doi.org/10.1038/s41467-017-02411-5
Stolaroff, J. K., Samaras, C., O'Neill, E. R., Lubers, A., Mitchell, A. S., & Ceperley, D. (2018b). Author correction: Energy use and life cycle greenhouse gas emissions of drones for commercial package delivery. Nature Communications, 9, Article 1054. https://doi.org/10.1038/s41467-018-03457-9
Urban Freight Lab. (2018). The final 50 feet urban goods delivery system: Common carrier locker pilot test at the Seattle Municipal Tower. Supply Chain Transportation and Logistics Center, University of Washington. https://urbanfreightlab.com/wp-content/uploads/2023/04/Final-50-Feet-Common-Carrier-Locker-Pilot-Report.pdf
U.S. Bureau of Labor Statistics. (2024a, November 8). Employer-reported workplace injuries and illnesses – 2023 [News release]. https://www.bls.gov/news.release/archives/osh_11082024.htm
U.S. Bureau of Labor Statistics. (2024b, December 19). National census of fatal occupational injuries in 2023 (USDL-24-2564) [News release]. https://www.bls.gov/news.release/archives/cfoi_12192024.pdf
U.S. Bureau of Labor Statistics. (n.d.). Couriers and messengers: NAICS 492. Industries at a Glance. Retrieved October 24, 2026, from https://www.bls.gov/iag/tgs/iag492.htm
U.S. Census Bureau. (2026, August 18). Quarterly retail e-commerce sales: 2nd quarter 2026. https://www.census.gov/retail/ecommerce.html
Verlinghieri, E., Itova, I., Collignon, N., & Aldred, R. (2021). The promise of low-carbon freight: Benefits of cargo bikes in London. Possible and Active Travel Academy, University of Westminster. https://www.bicyclenetwork.com.au/wp-content/uploads/2021/08/The-Promise-of-Low-Carbon-Freight.pdf
World Economic Forum. (2020). The future of the last-mile ecosystem: Transition roadmaps for public- and private-sector players. https://www3.weforum.org/docs/WEF_Future_of_the_last_mile_ecosystem.pdf
Videos
MIT Center for Transportation & Logistics. (2017, March 7). Matthias Winkenbach on megacity logistics [Video]. YouTube. https://www.youtube.com/watch?v=_86oTGYXzYM
MIT Center for Transportation & Logistics. (2021, April 28). Last mile logistics at MIT Center for Transportation & Logistics [Video]. YouTube. https://www.youtube.com/watch?v=5DSaU9Xongg
Song, V. (2019, April 24). Redesigning last mile delivery [Video]. TEDx Talks. https://www.youtube.com/watch?v=C2PgKX_czus
Supply Chain Transportation & Logistics Master's, University of Washington. (2020, February 7). Urban Freight Lab: Our impact [Video]. YouTube. https://www.youtube.com/watch?v=a4QilH3qJCQ
Winkenbach, M. (2023, April 26). Last-mile logistics on steroids [Video]. MIT Mobility Initiative. https://www.youtube.com/watch?v=7_ZCA8_ntqQ